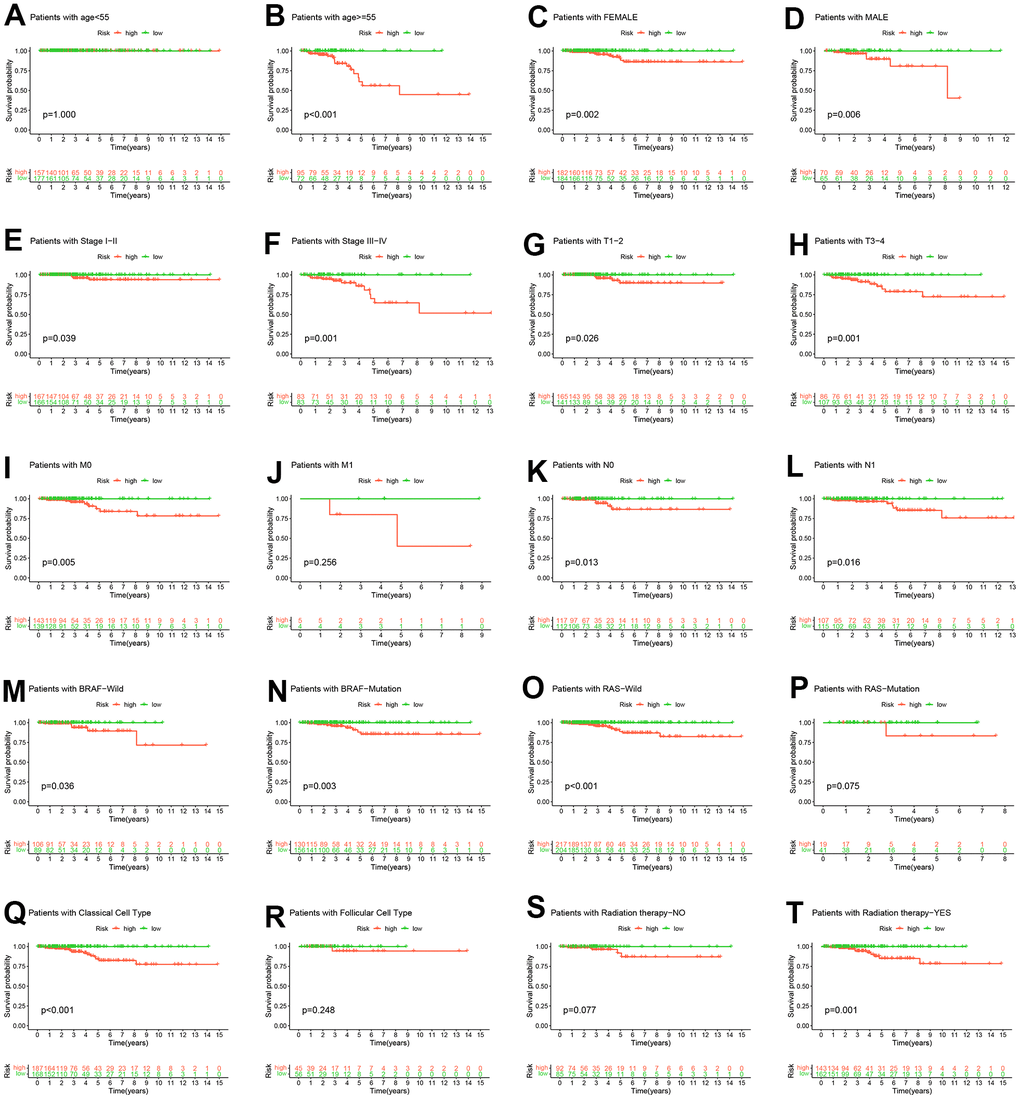
Figure 6.Hierarchical analysis. K-M curve analysis of OS probability was based on risk scores grouped by age (A, B), sex (C, D), stage (E, F), T (G, H), M (I, J), N (K, L), BRAF (M, N), RAS (O, P), pathological subtype (Q, R) and radiation therapy (S, T).