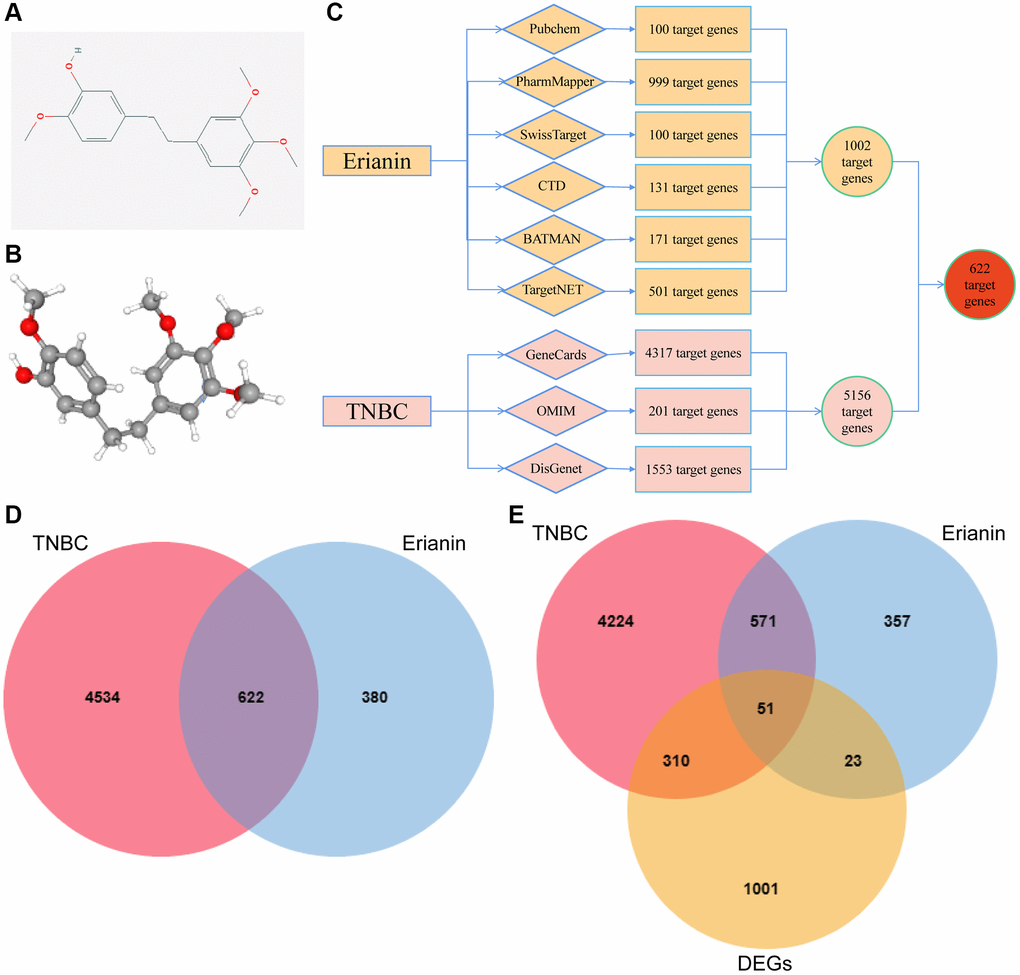
Figure 4.Screening of target genes for anti-TNBC activity of Erianin. (A) 2D structure of the Erianin molecule. (B) 3D structure of the Erianin molecule; (C) Flowchart of the screening process of target genes of Erianin anti-TNBC obtained by network pharmacological analysis. (D) Venn diagram of target genes of Erianin in anti-TNBC obtained by network pharmacological analysis; (E) Venn diagram of target genes identified in network pharmacology analysis and differentially expressed genes (DEGs).