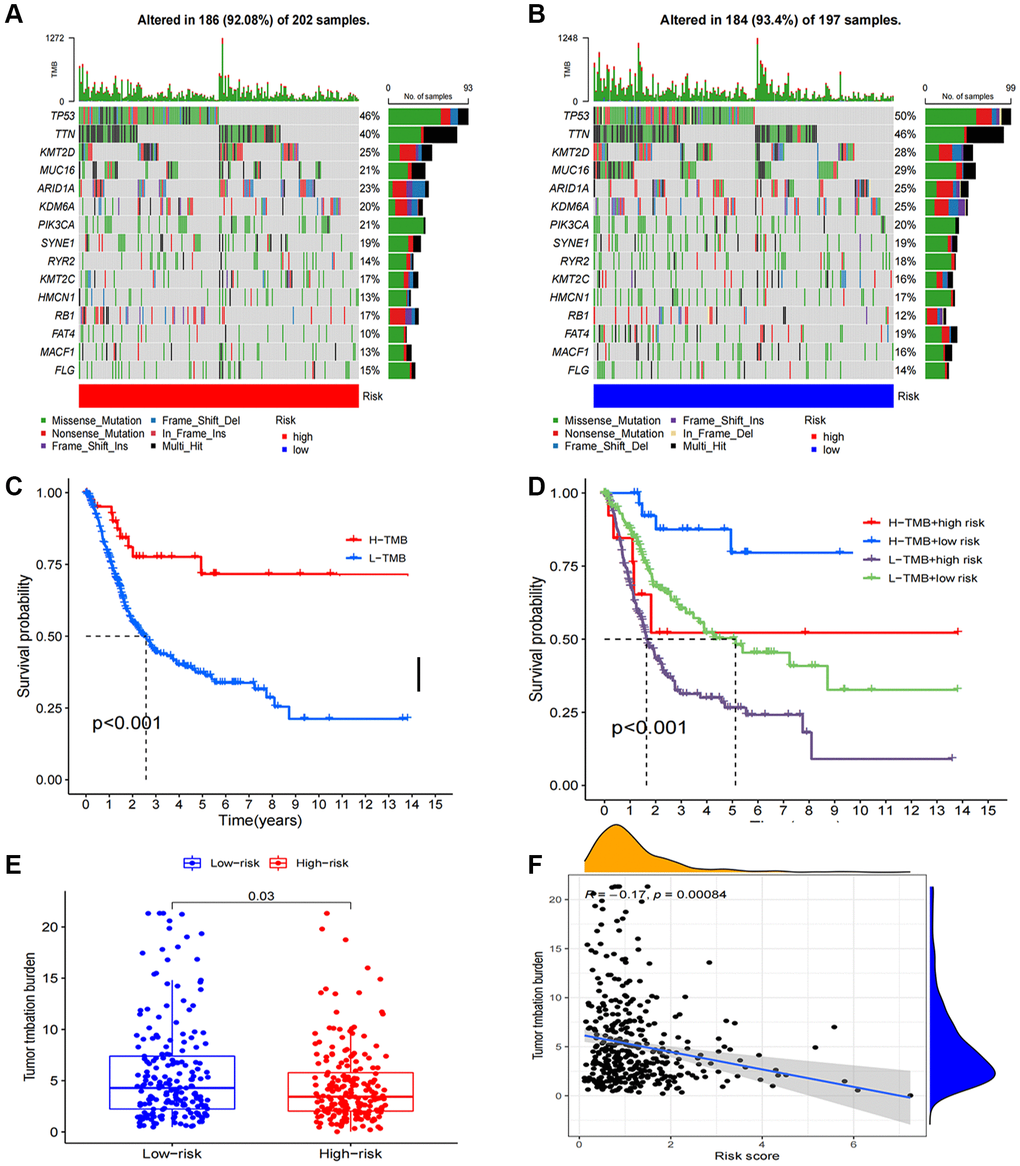
Figure 8.Tumor mutation burden calculation analysis. (A, B) Tumor somatic mutation waterfall graph in high-risk group and low-risk group; (C) Kaplan–Meier curve of OS analyzed for TMB; (D) Kaplan–Meier curve of OS analyzed for TMB and risk groups; (E) The relationship between TMB and risk groups; (F) Correlation analysis of the risk score and TMB.