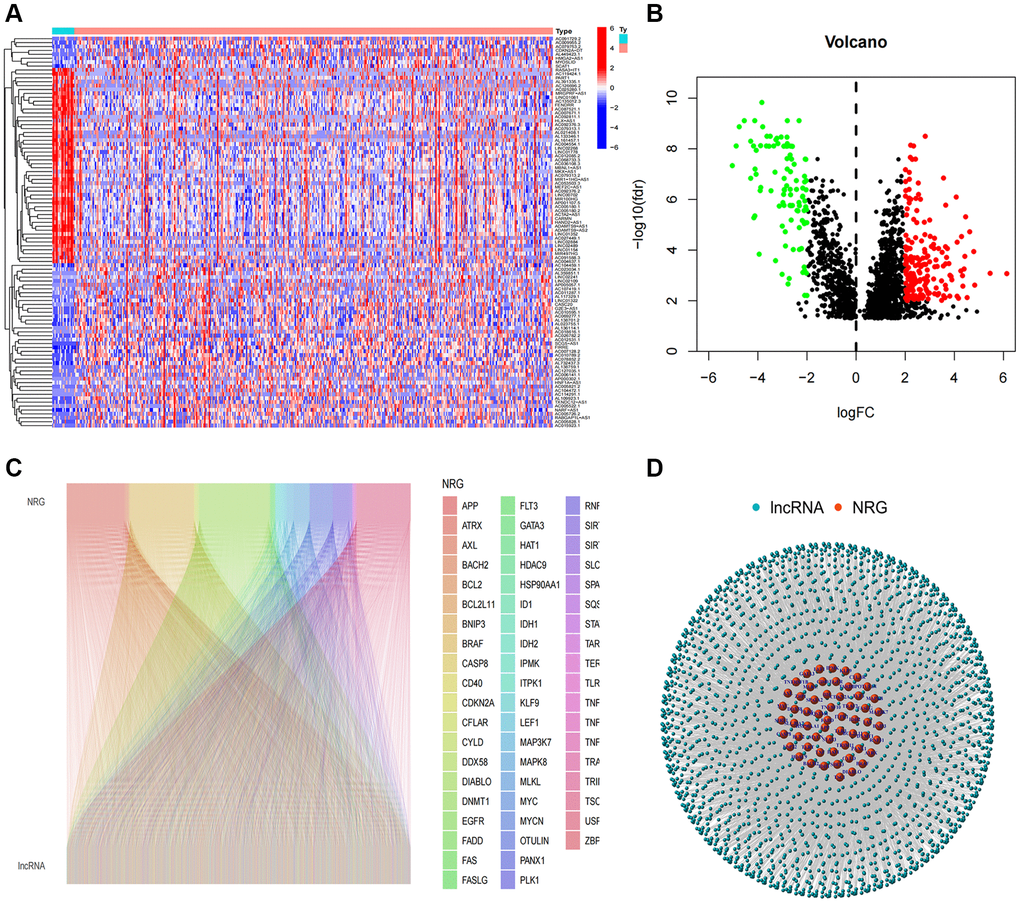
Figure 1.Identification of necroptosis-related lncRNAs. (A) Heatmap of differentially expressed NRlncRNAs based on their expression levels; (B) The volcano diagram of differentially expressed NRlncRNAs; (C) Sankey diagram of necroptosis-related genes and lncRNAs; (D) The network of necroptosis genes and lncRNAs.