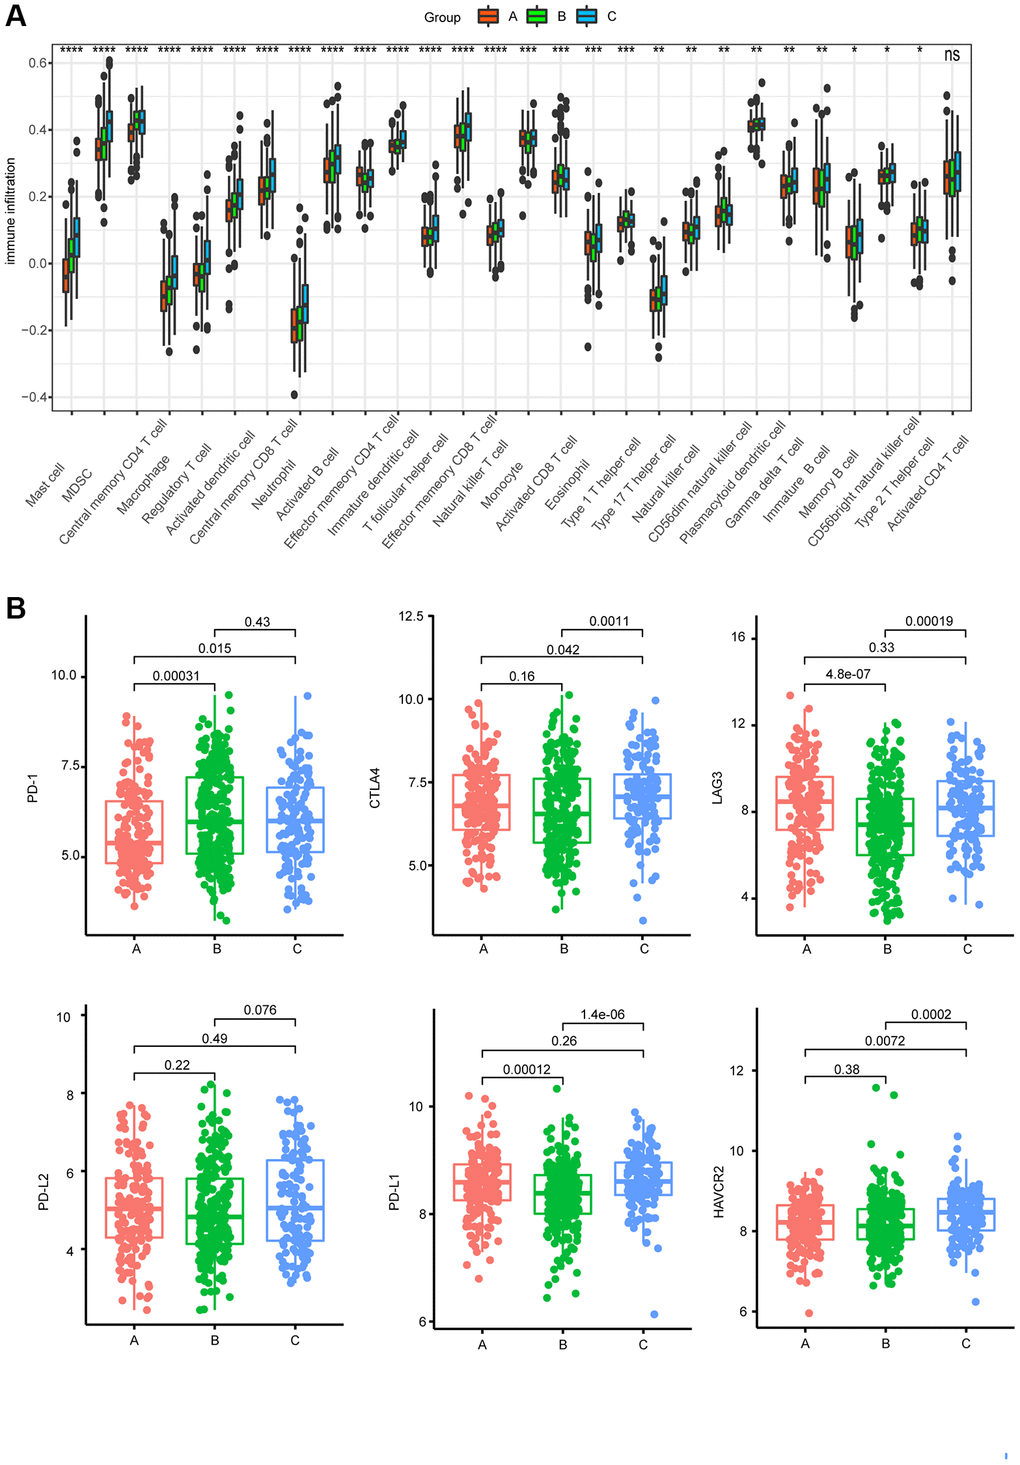
Figure 3.Characteristics of immunity in different subgroups. (A) Differences in 28 infiltrating immune cells among the three AAG clusters (*P < 0.05; **P < 0.01; ***P < 0.001; ****P < 0.0001). (B) Expression of 6 ICPs in the three subtypes.
Figure 3 — Identification of an angiogenesis-related risk score model for survival prediction and immunosubtype screening in multiple myeloma | Aging