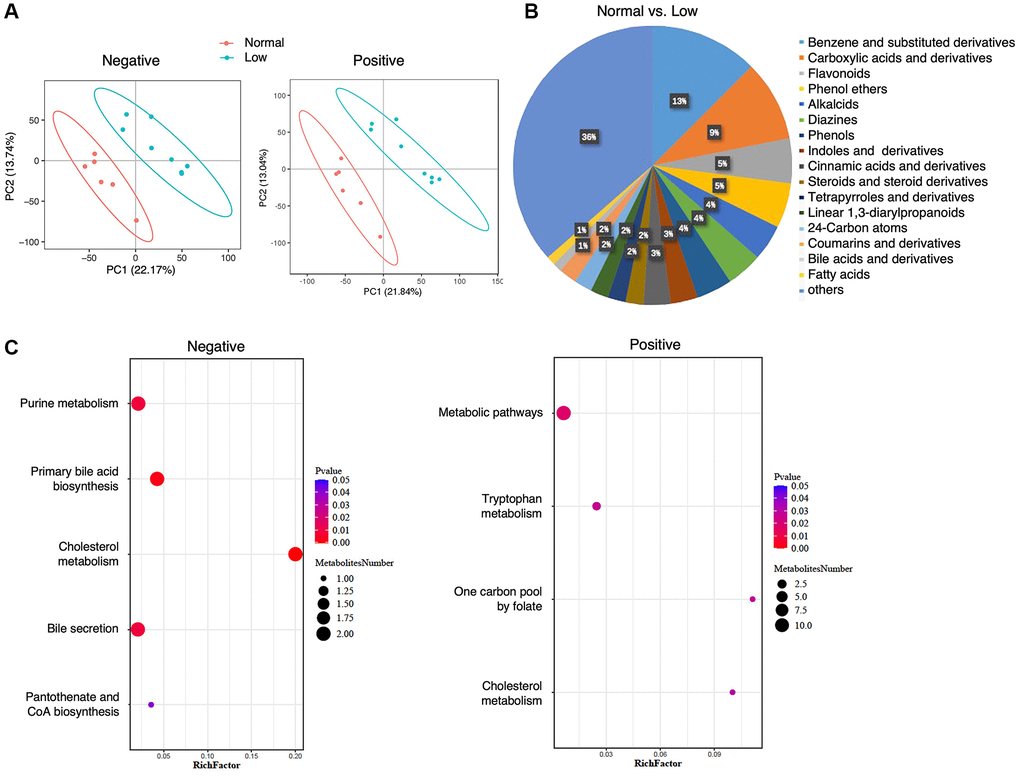
Figure 4.Fecal metabolomics analysis. (A) PLS-DA analysis of the grouped discrimination by the first two principal components (PCs) in the negative- and positive-ion modes. (B) Pie graph of the class composition according to the number of altered metabolites. (C) Bubble chart of pathway enrichment analysis of differential metabolites analyzed in the negative- and positive-ion modes. RichFactor was the number of differential metabolites divided by the identified metabolites annotated to the pathway.