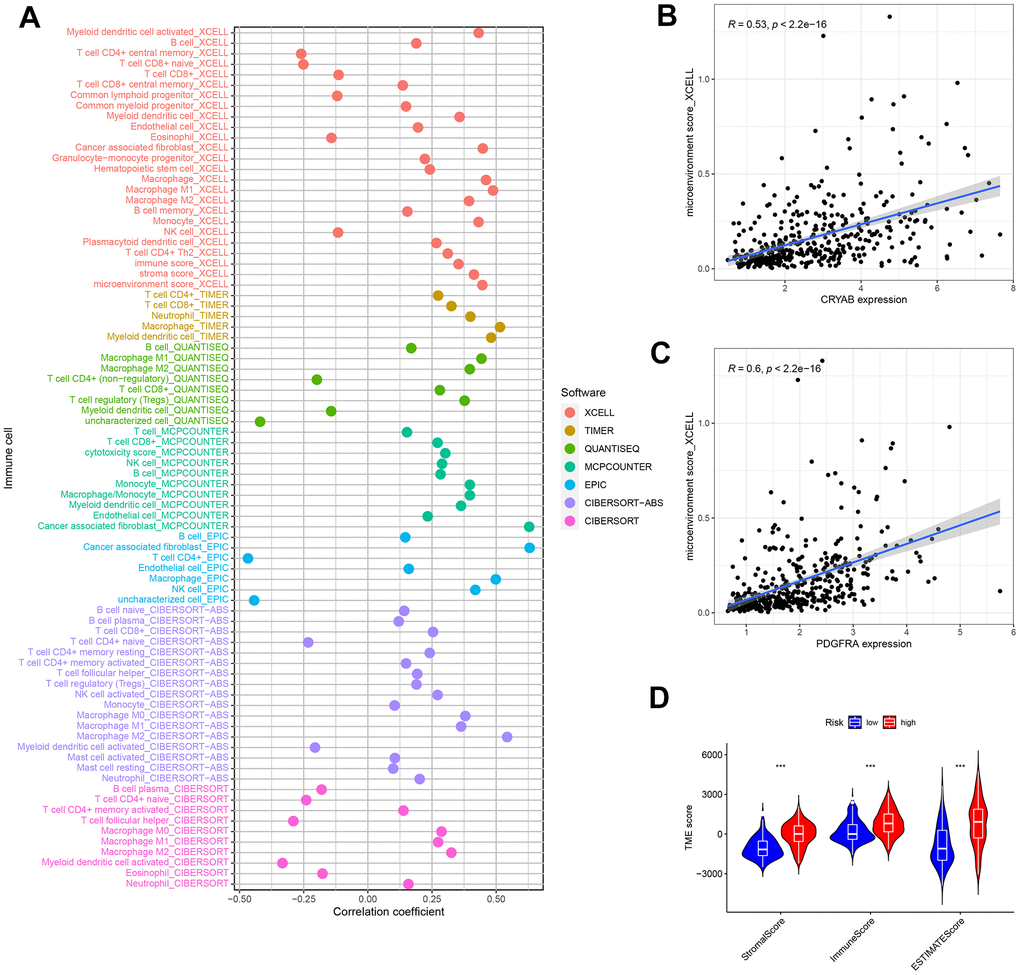
Figure 10.Tumor-infiltrating cells abundance estimation. (A) The significantly stronger correlation exists in the high-risk group as shown by the Spearman correlation analysis. (B, C) The correlation between the microenvironment and CRYAB and PDGFRA expression. (D) The TME score in the low and nigh risk groups.