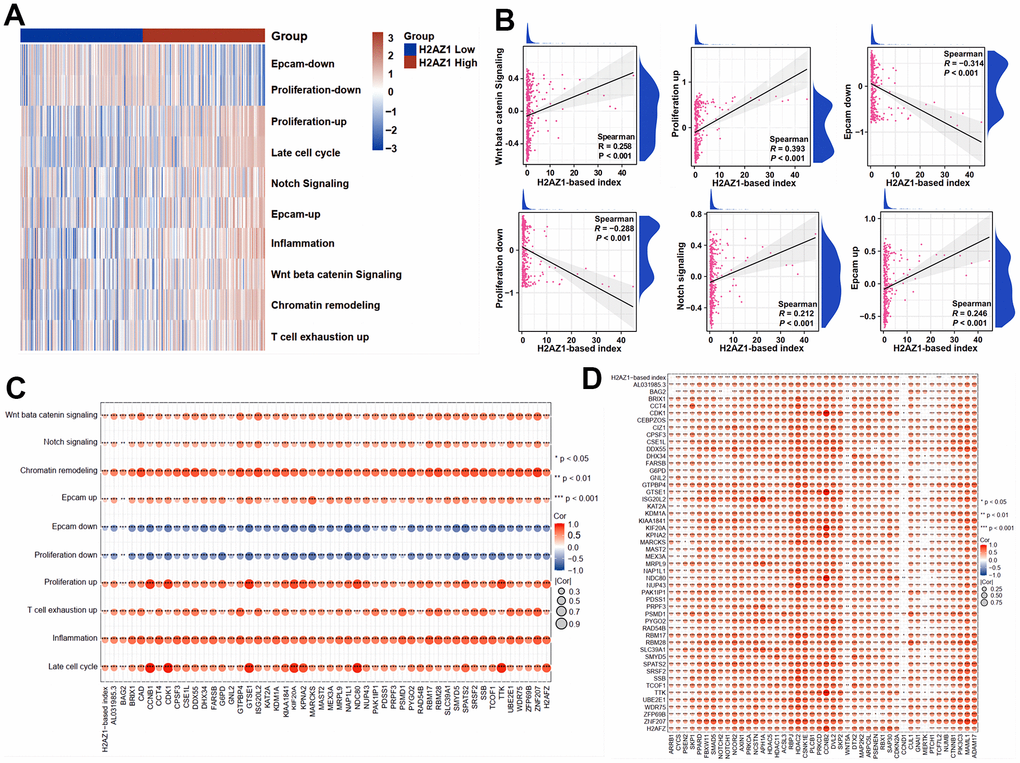
Figure 5.Expression of stemness-related pathway scores in high and low H2AZ1-based index groups. (A) Heat map showing the expression of stemness-related pathway scores in high and low H2AZ1-based index groups. (B) Scatter plot showing the correlation between H2AZ1-based index and tumor stemness-related pathway score. (C) Bubble chart showing the correlation between H2AZ1-based index genes and tumor stemness-related pathway scores. (D) Bubble chart showing the correlation between H2AZ1-based index genes and tumor stemness-related genes.