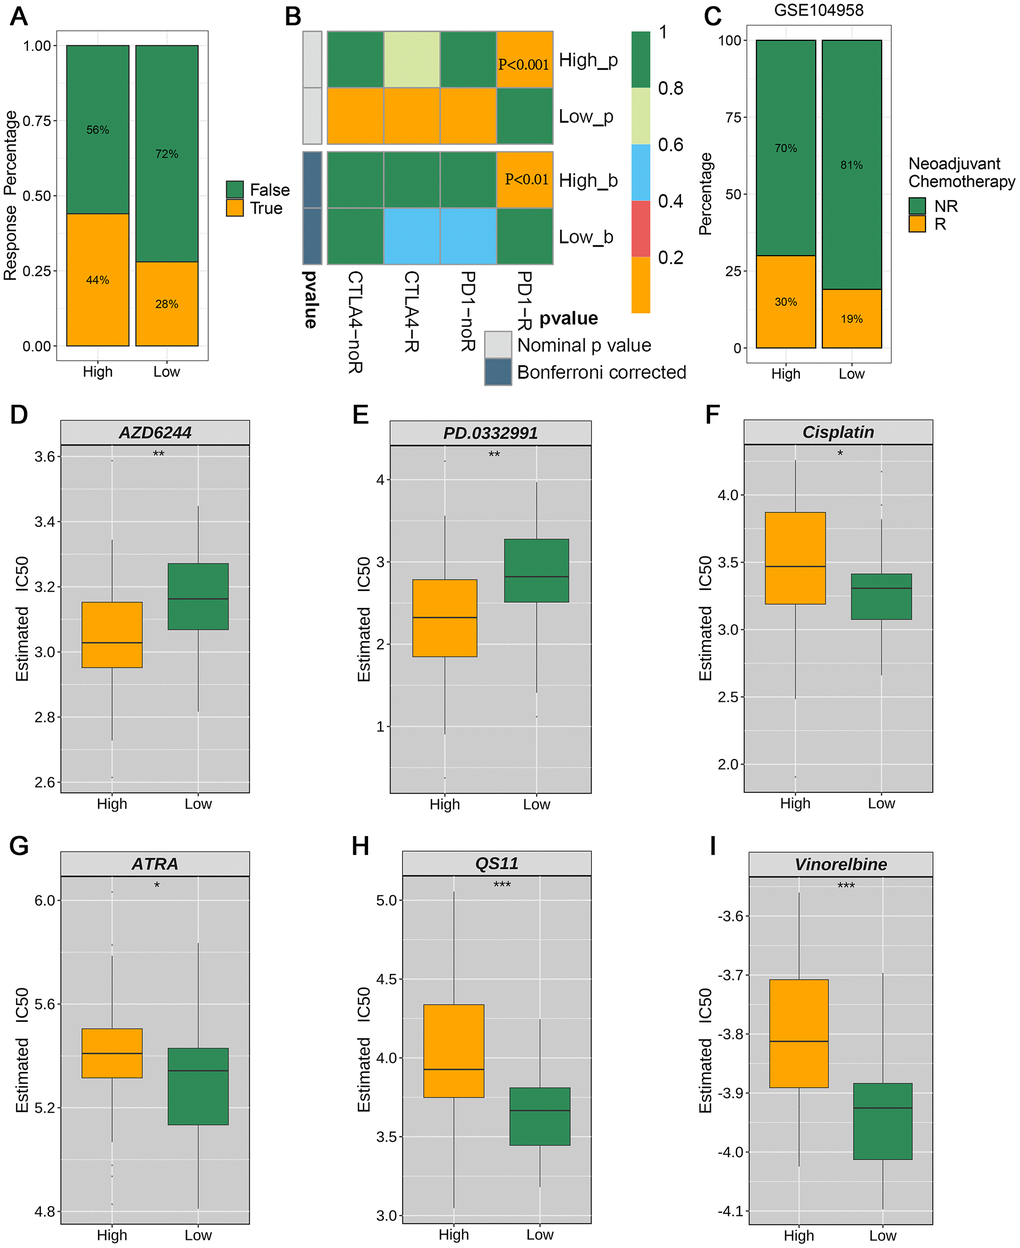
Figure 7.Evaluation of clinical immunotherapy responses and drug sensitivity (A) TIDE analysis forecasts the proportion of responsive patients to immunotherapy in the high- and low-risk groups stratified by the prognostic model. (B) SubMap analysis unveiled significant divergence in anti-PD-1 immunotherapy response between the high-risk and low-risk groups. (C) Proportions of neoadjuvant chemotherapy response between high-risk and low-risk patient groups in the GSE104958 data set. (D–I) Treatment response rates to six chemotherapy agents based on drug sensitivity scores.