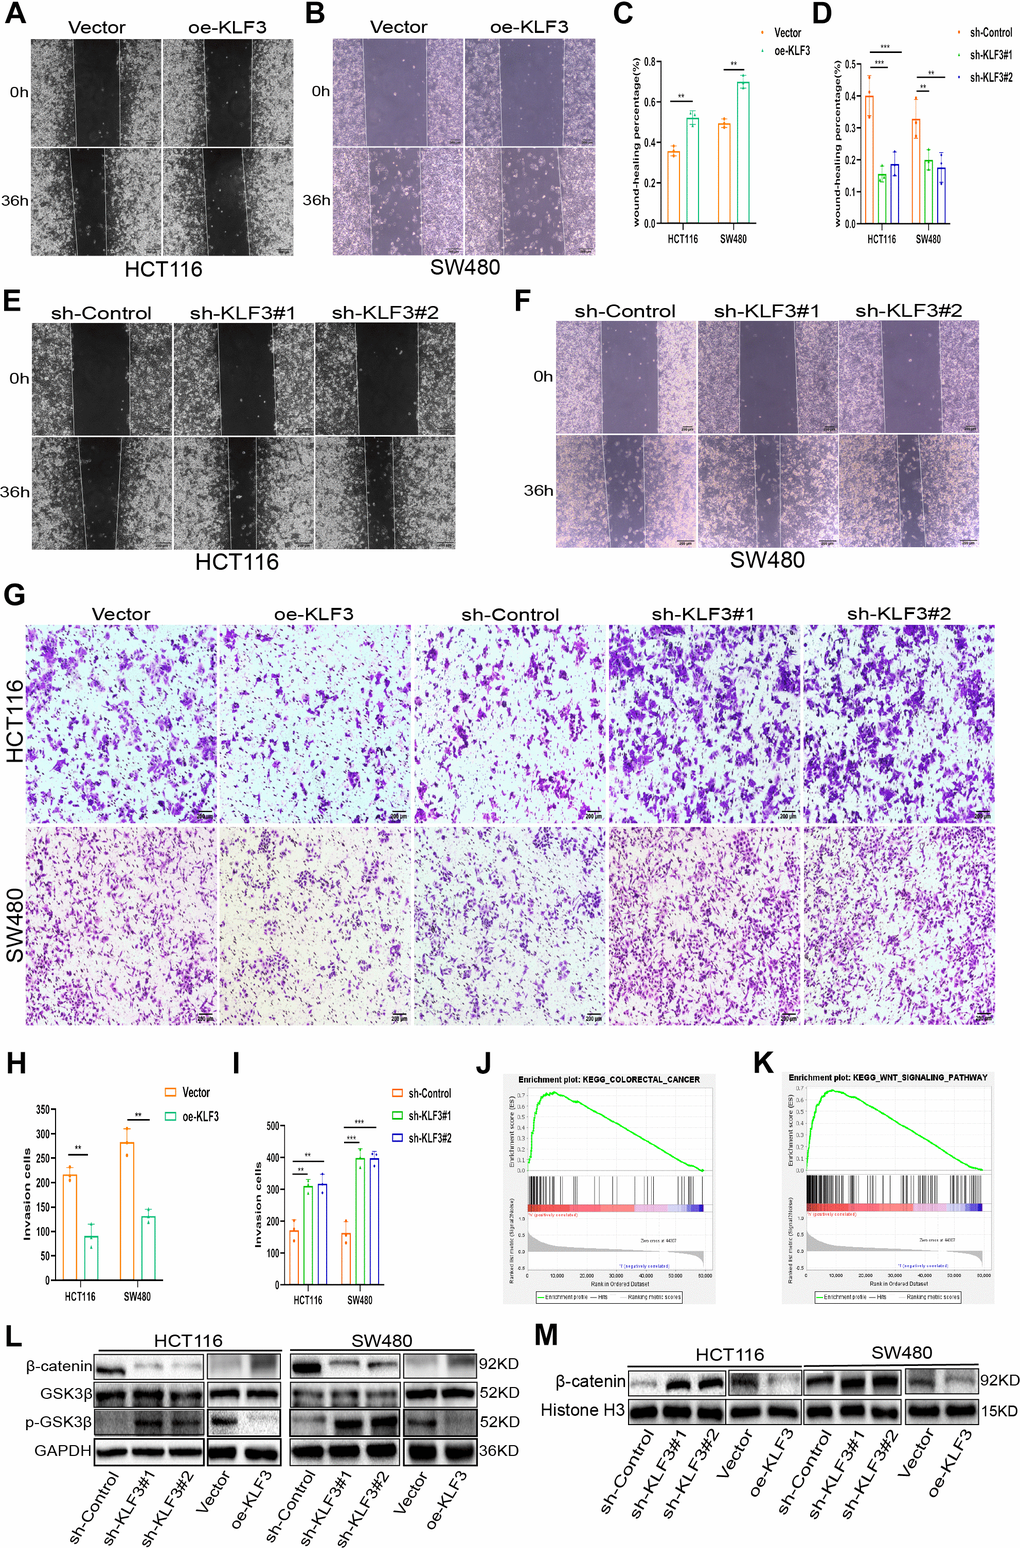
Figure 3.KLF3 knockdown enhances invasion in CRC cells and activates the WNT/β-catenin axis. (A–F) Representative wound-healing images showing migration in oe-KLF3 and KLF3-knockdown cells. The percentage was calculated according to the change in distance between each side. (G–I) Representative images showing the invasive capacity of CRC cells with up- and down-regulated KLF3 expression. (J, K) GSEA showing positive correlations between KLF3 expression, CRC progression, and the WNT/β-catenin axis. (L, M) Levels of markers associated with the WNT/β-catenin axis, including GSK3β, p-GSK3β (Ser9), and nuclear β-catenin in oe-KLF3 and KLF3-knockdown CRC cells. The data represent means ± standard deviation. Scale bars: 50 μm. **p < 0.01; ***p < 0.001.