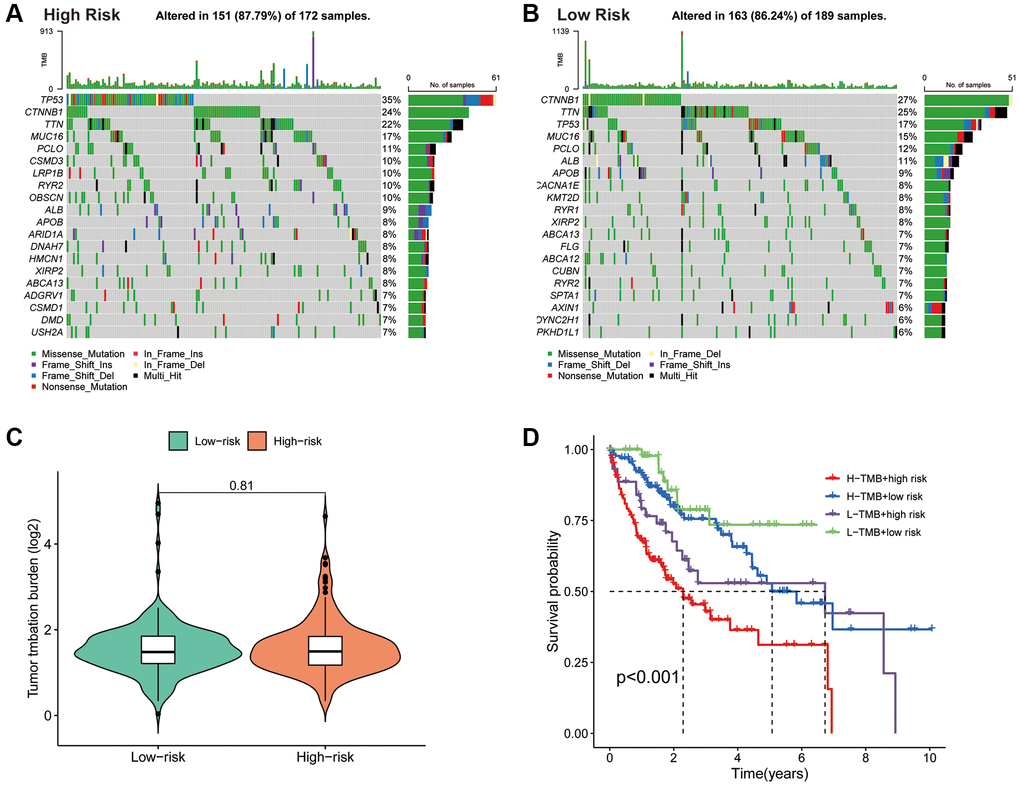
Figure 8.Association of the PANRI with TMB in hepatocellular carcinoma. (A) Mutation waterfall map showing the 20 genes with the highest mutation frequency in the high-risk group. (B) Mutation waterfall map showing the 20 genes with the highest mutation frequency in the low-risk group. (C) Comparison of TMB between the two risk groups. (D) Kaplan–Meier curves for the TMB subgroups combined with the risk subgroups.