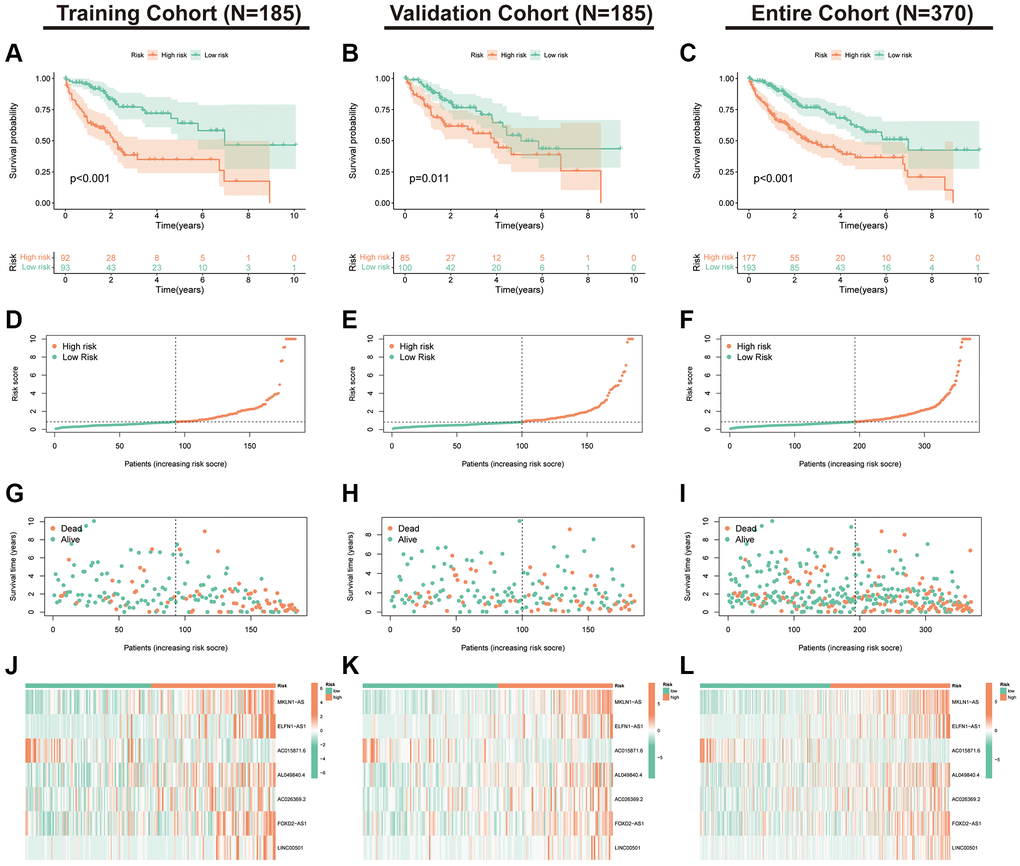
Figure 4.Validation of the PANRI in hepatocellular carcinoma. (A–C) Kaplan–Meier curves for overall survival in the training (N = 185), validation (N = 185) and entire (N = 370) cohorts. (D–F) Risk score distribution in the three cohorts. (G–I) Survival status in the three cohorts. (J–L) Heatmap of the expression of the seven PANoptosis-related lncRNAs in the three cohorts.