Submit an Article
Navigate
Home
Editorial Board
Editorial Policies
Current Volume
Archive
Scientific Integrity
Publication Ethics Statements
Interviews with Outstanding Authors
Newsroom
Sponsored Conferences
Podcast
Contact
Special Collections
Submit an Article
Online ISSN: 1945-4589
Research Paper
|
Volume 16, Issue 3
|
pp. 2299–2319
Identification of molecular characteristics of FUT8 and alteration of core fucosylation in kidney renal clear cell cancer
Back to article
Figure 9
(9 of 9)
−
100%
+
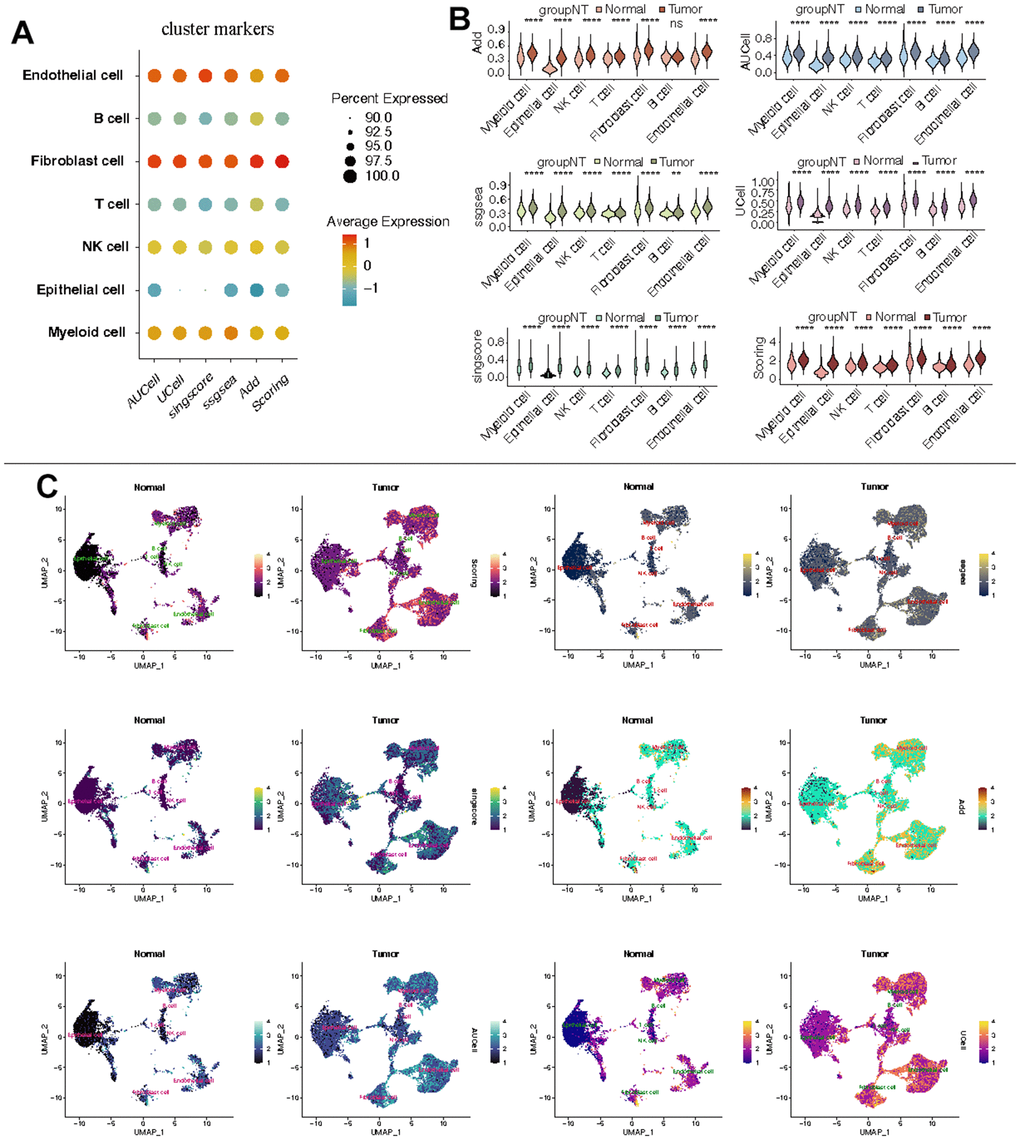
Figure 9.
Estimation of CF state based on scRNA-Seq data.
(
A
) CF state in each cell type; (
B
) Discrepancies of CF state in each cell type between KIRC and normal samples; (
C
) Detailed CF state depicted in a UMAP plot.