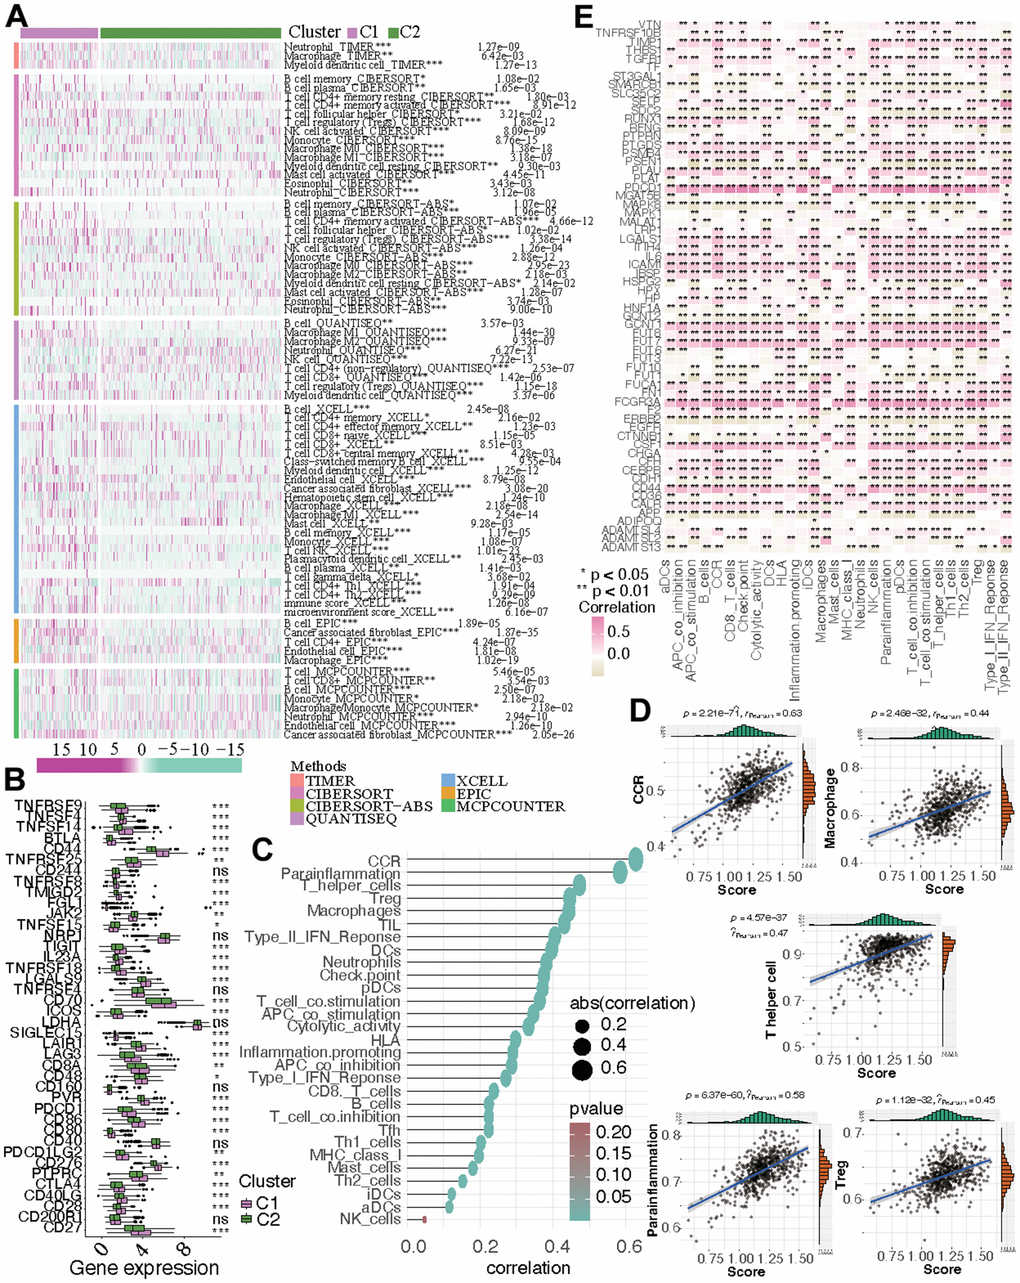
Figure 3.The immune microenvironment in the two subtypes. (A) The discrepancies of immune response in the two KIRC subtypes. (B) The altered expression of ICGs. (C, D) The correlation between immune-related process and CF score. (E) The correlation between immune-related process and the expression of CF-related genes.