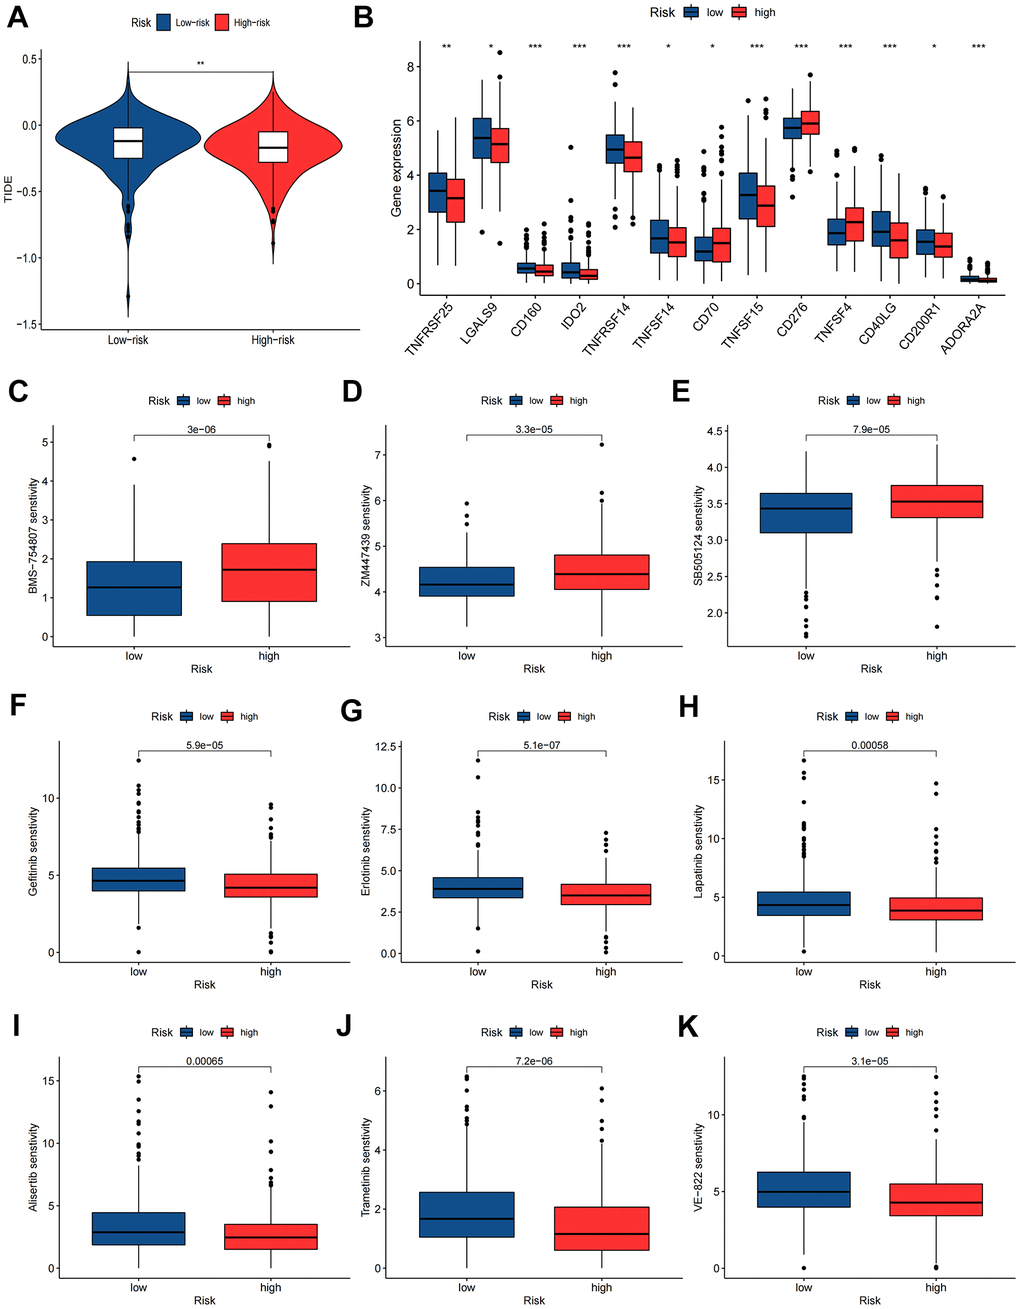
Figure 10.Immunotherapy and chemotherapy sensitivity. (A) Tumor immune dysfunction and exclusion (TIDE) algorithm analysis for the high-risk and low-risk groups. (B) Immune checkpoint genes expression level between high-risk and low-risk groups. (C–K) Chemosensitivity difference between high-risk and low-risk groups. *P<0.05; **P<0.01; ***P<0.001.