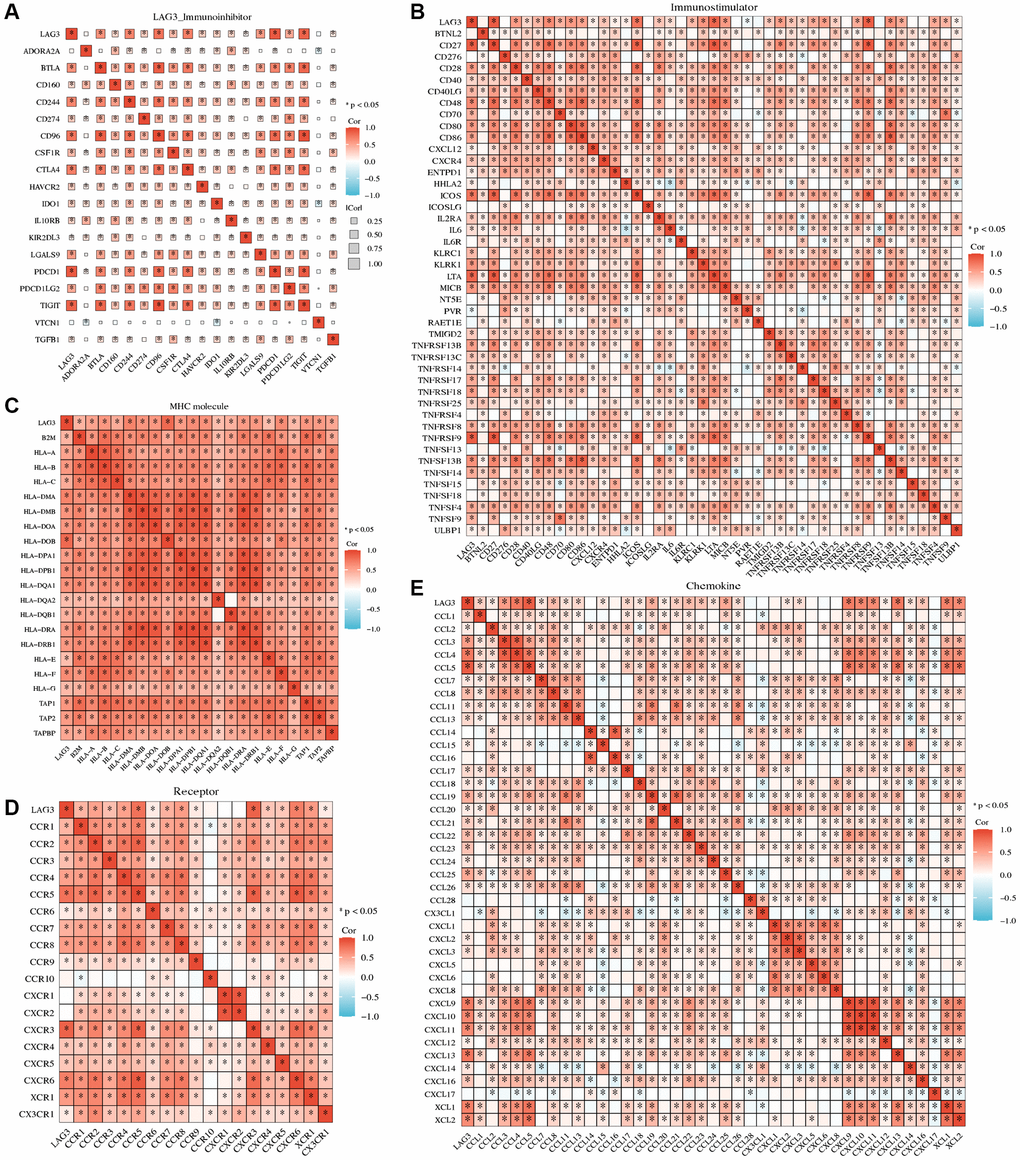
Figure 3.Association between LAG3 expression and immune-related molecules. The heatmap displays the correlation of LAG3 expression with immunoinhibitors (A), immunostimulators (B), MHC (C), receptors (D), and chemokines (E) in KIRC.
Figure 3 — Integrative analysis of LAG3 immune signature and identification of a LAG3-related genes prognostic signature in kidney renal clear cell carcinoma | Aging