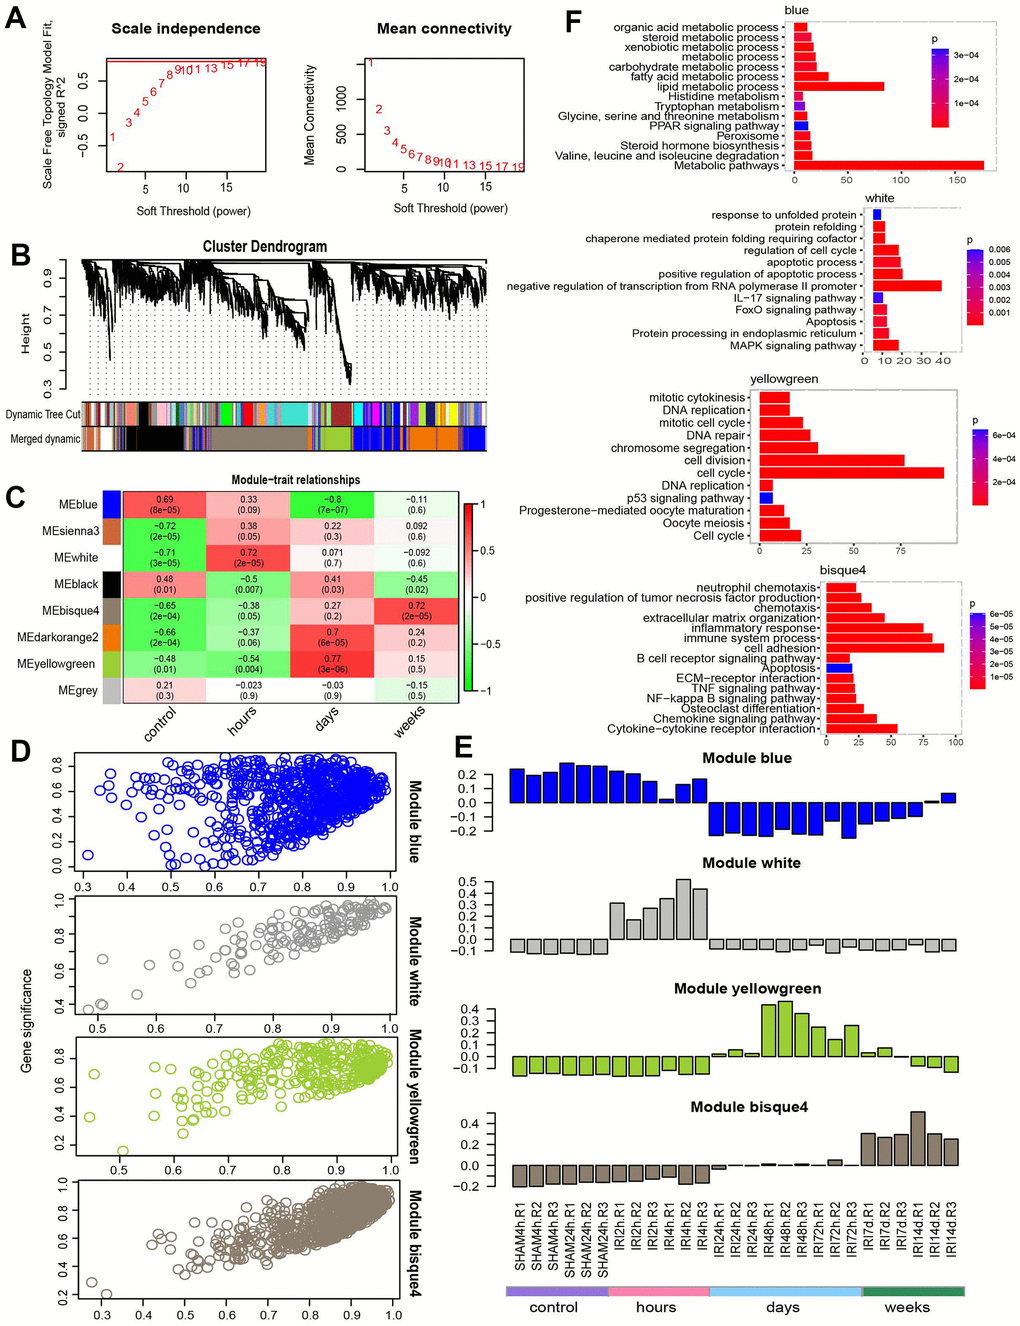
Figure 4.WGCNA analysis. (A) Power selection. (B) Dendrogram of coexpression network. (C) The module trait association heatmap. (D) Scatter plot for module membership and gene significance. (E) Barplot for the eigengene in each module. (F) The functions for each module.