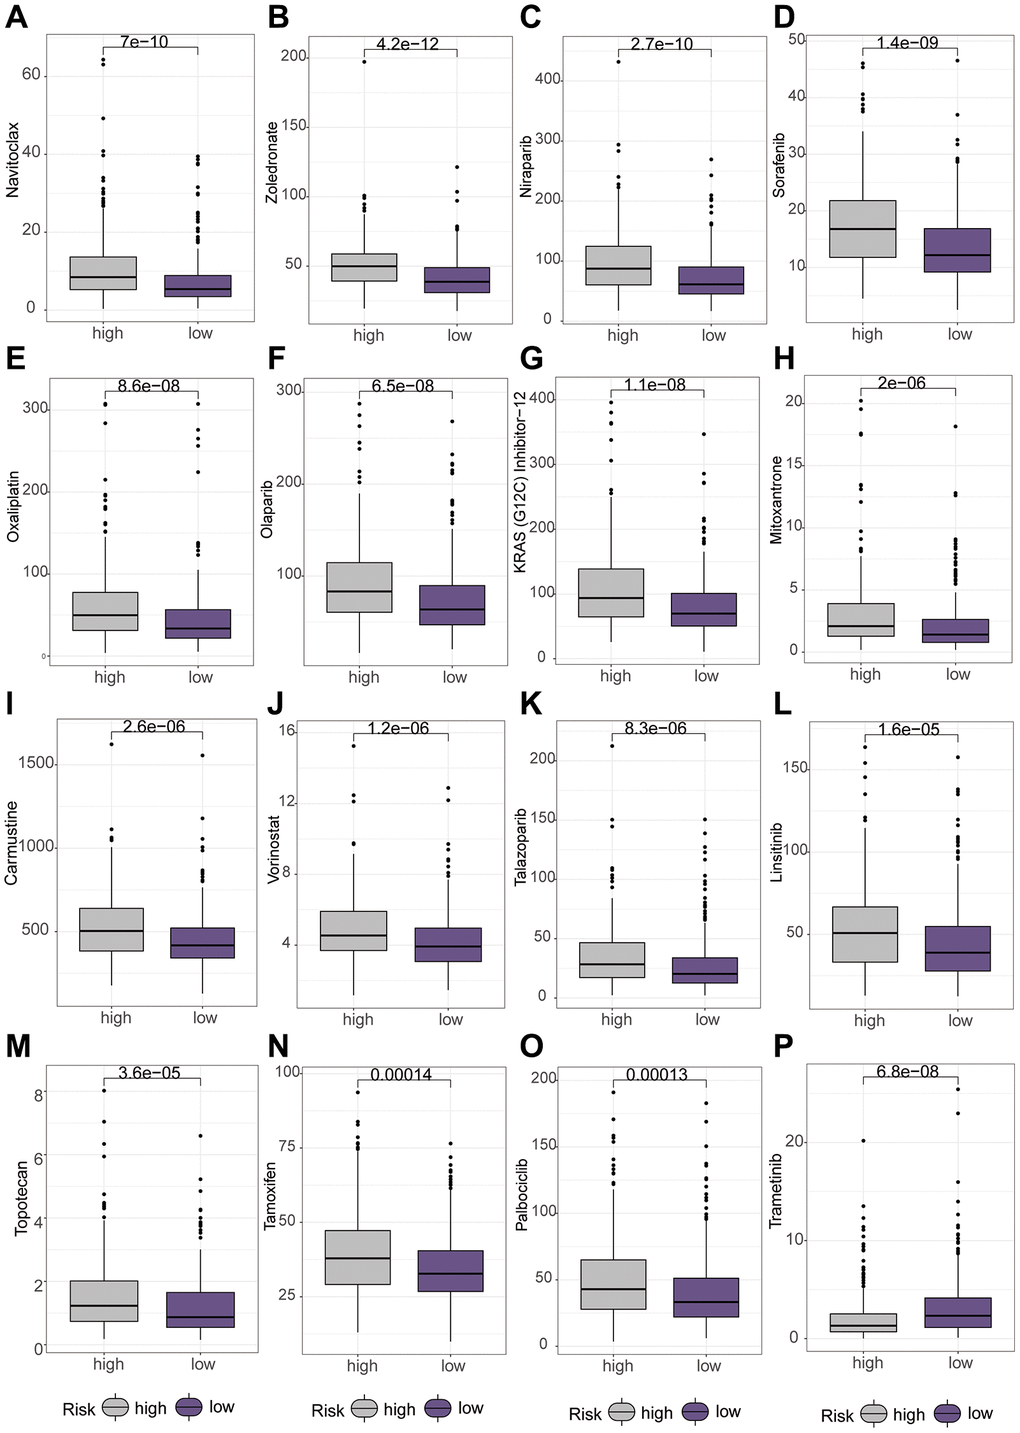
Figure 8.Differential analysis of various chemotherapeutic drugs between high and low-risk groups using the “oncopredict” package. (A–O) Higher IC50 values of different chemotherapeutic drugs in the low-risk group. (P) Higher IC50 values of chemotherapeutic drug in the high-risk group.