Submit an Article
Navigate
Home
Editorial Board
Editorial Policies
Current Volume
Archive
Scientific Integrity
Publication Ethics Statements
Interviews with Outstanding Authors
Newsroom
Sponsored Conferences
Podcast
Contact
Special Collections
Submit an Article
Online ISSN: 1945-4589
Research Paper
|
Volume 16, Issue 2
|
pp. 1860–1878
The integration of multi-omics analysis and machine learning for the identification of prognostic assessment and immunotherapy efficacy through aging-associated genes in lung cancer
Back to article
Figure 4
(4 of 10)
−
100%
+
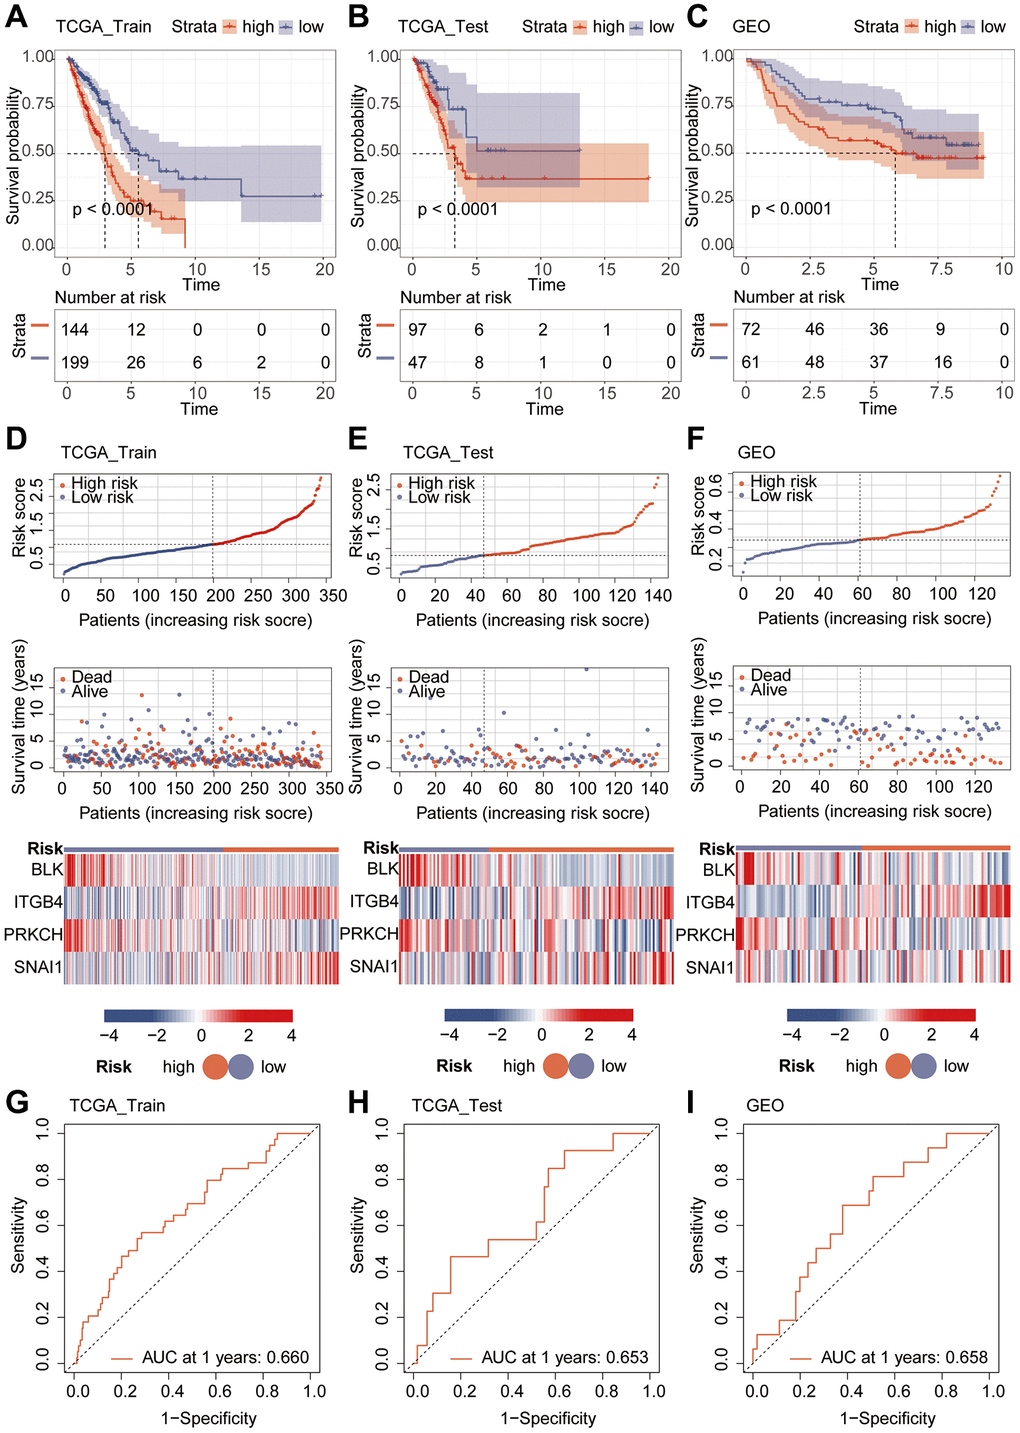
Figure 4.
Validation of model performance.
(
A
–
C
) Prognostic analysis using Kaplan-Meier curves for the riskScore model. (
D
–
F
) Heatmap and risk curve analysis of the riskScore model. (
G
–
I
) ROC analysis of the riskScore Model.