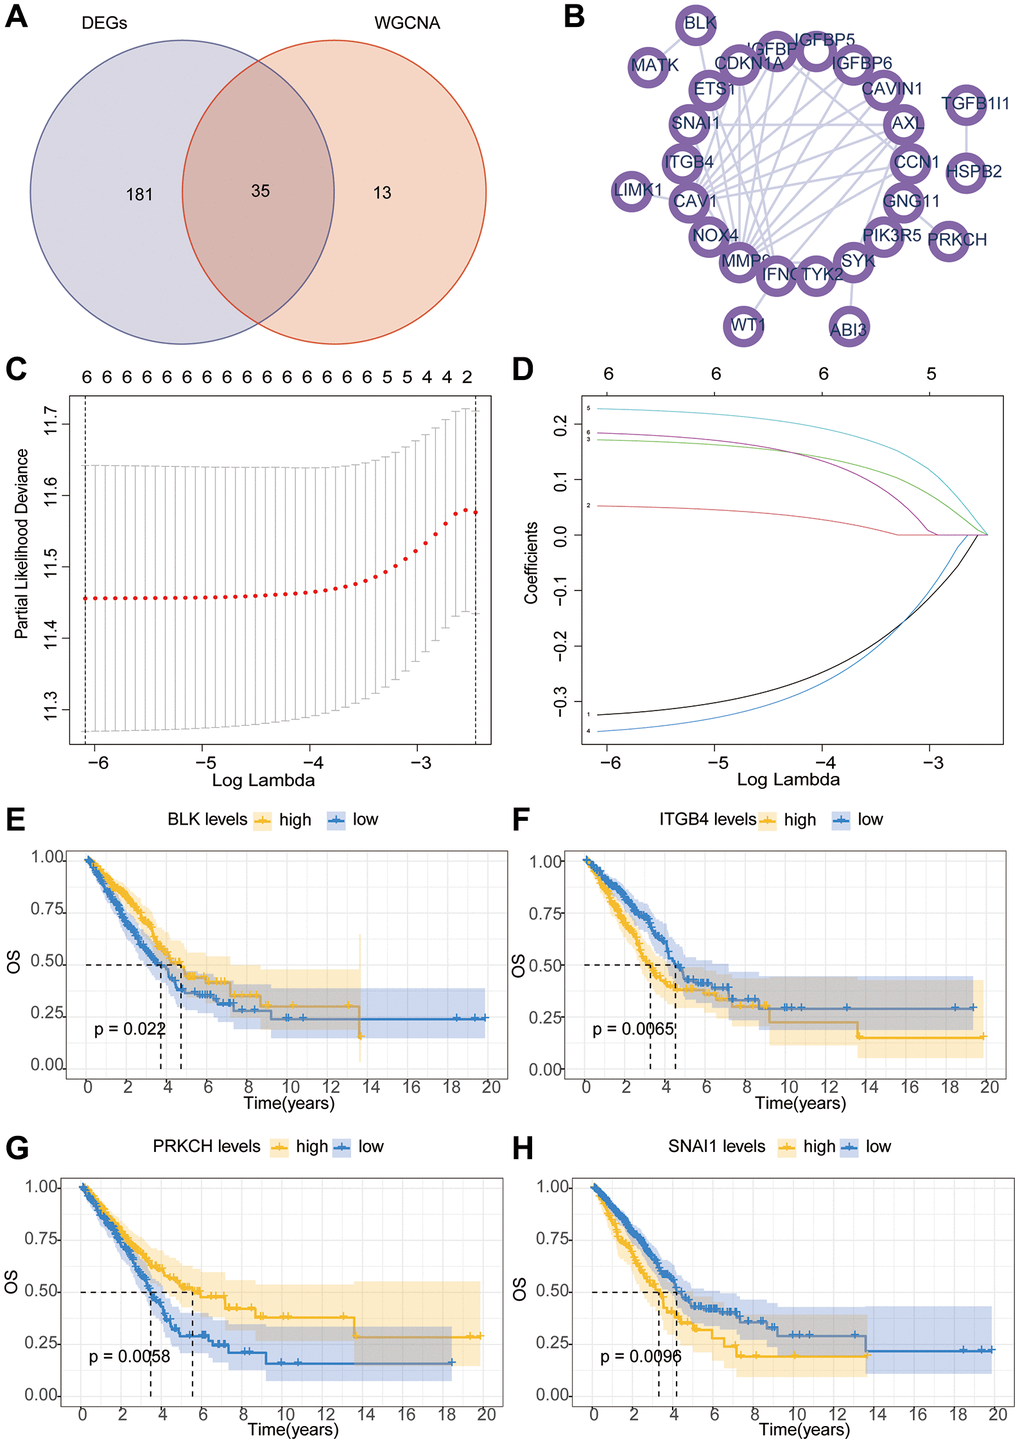
Figure 3.The Lasso-Cox algorithm constructs a prognostic risk model. (A) The Venn diagram illustrates the intersection of genes between WGCNA and differential analysis. (B) The PPI (Protein-Protein Interaction) network investigates the interactions between key proteins. (C, D) The Lasso-Cox algorithm constructs a model. (E–H) Kaplan-Meier survival curve analysis of hub gene.