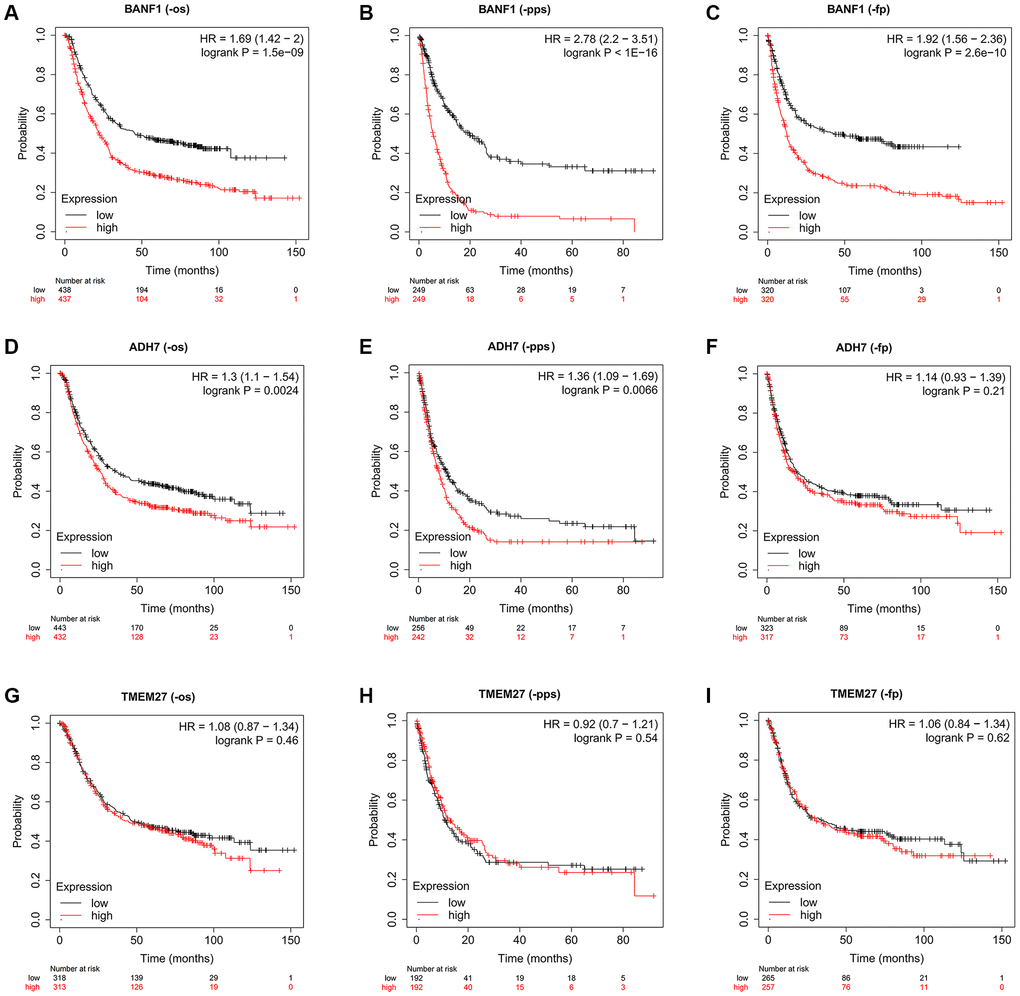
Figure 5.The prognostic value of three characteristic genes. (A–C) OS, PPS, FP km survival curves between high and low expression groups of BANF1. (D–F) OS, PPS, FP km survival curves between high and low expression groups of ADH7. (G–I) OS, PPS, FP km survival curves between high and low expression groups of TMEM27.