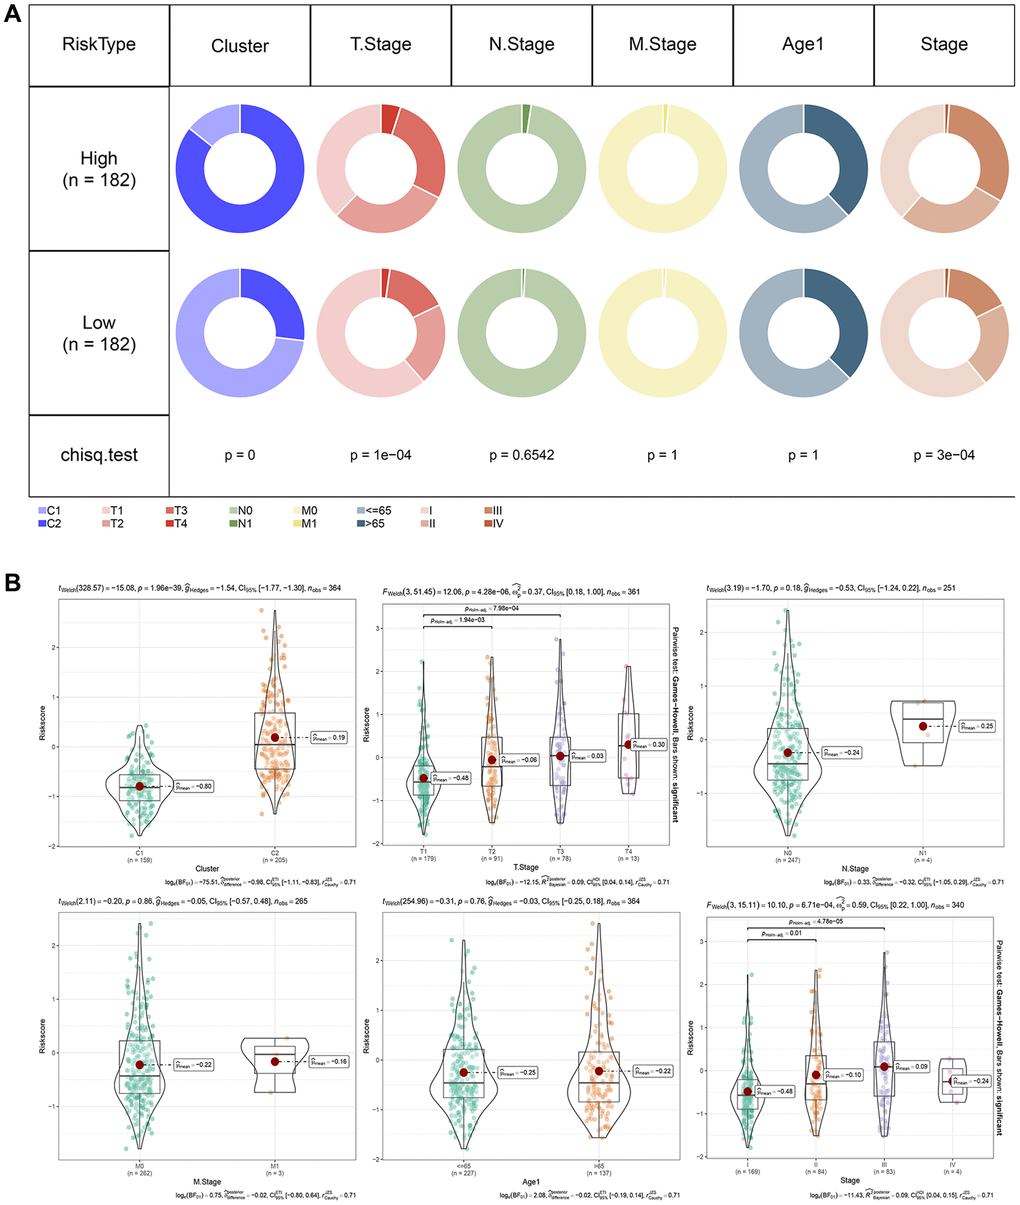
Figure 8.RiskScore in different clinicopathological features. (A) Comparison of clinical phenotypes between RiskScore groups in the TCGA cohort. (B) Differences between RiskScores of different phenotypes in the TCGA cohort (Wilcox. Test, *P < 0.05; **P < 0.01; ***P < 0.001; and ****P < 0.0001).