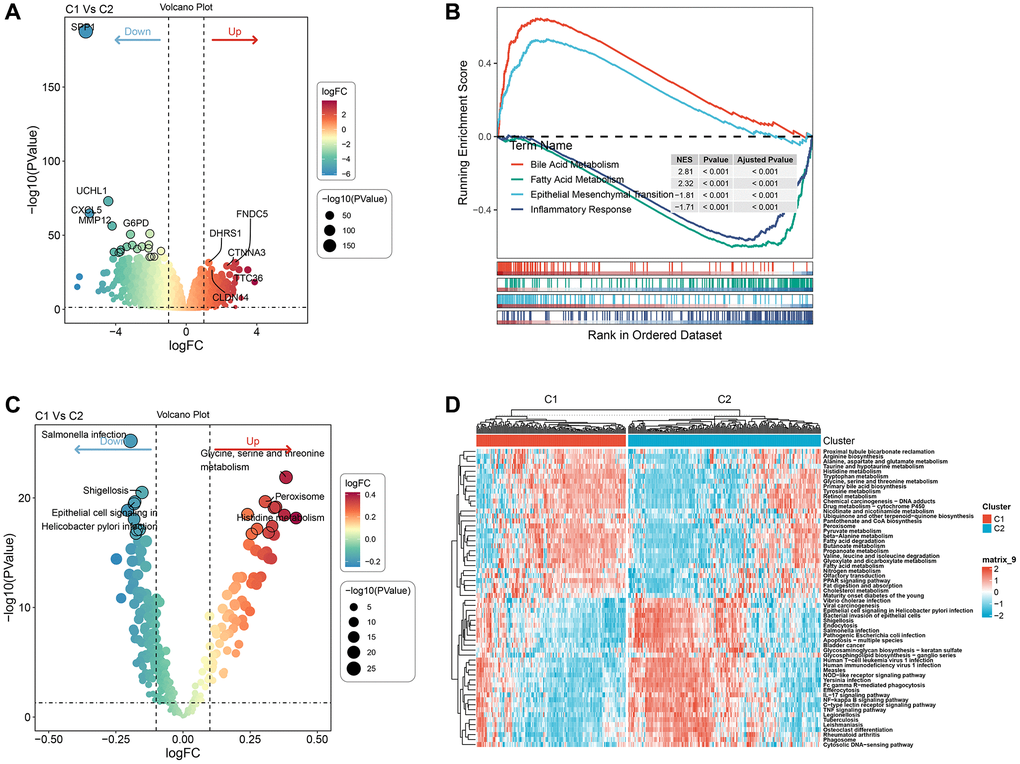
Figure 5.Pathway analysis of molecular subtypes. (A) Volcano map of differential analysis of genes between the two subtypes. (B) GSEA-GO analysis of differential genes between the two groups. (C) Bubble map of related pathways activated/inhibited in the comparison of the two subtypes. (D) Heat map of KEGG-related pathways with differences between the two subtypes.