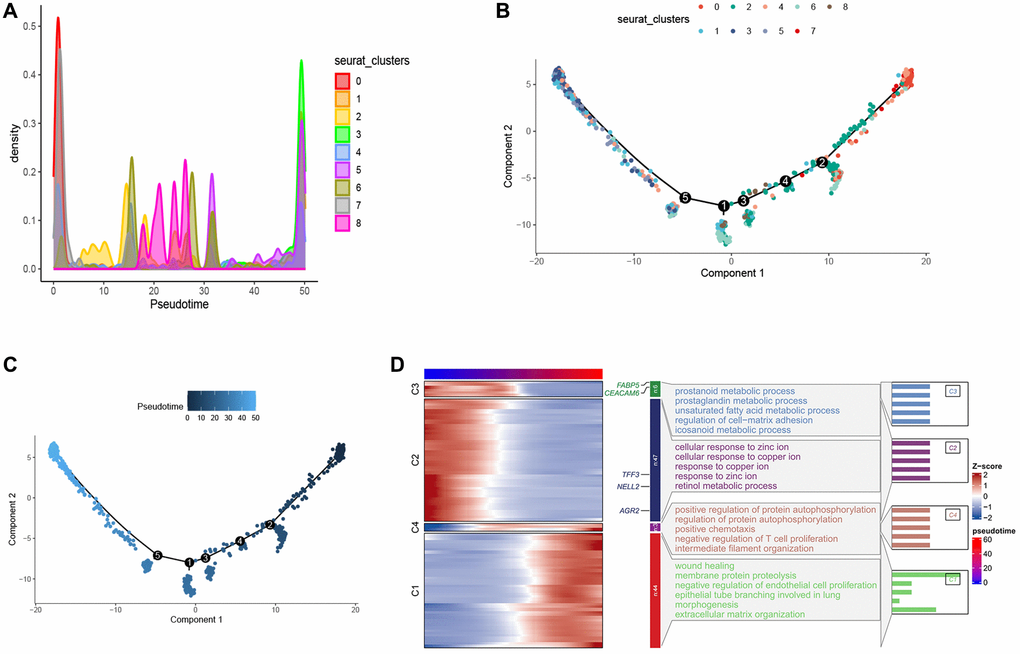
Figure 3.Pseudo-time series analysis of esophageal cancer cells. (A) Density map provides a visual representation of the distribution of tumor cell subtypes across a pseudo-time series. (B, C) Pseudo-time-ordered analysis of tumor cells. Tumor cell subtypes are labeled by colors. (D) Heatmap showing the dynamic changes in the expression of developmental genes over pseudo-time.