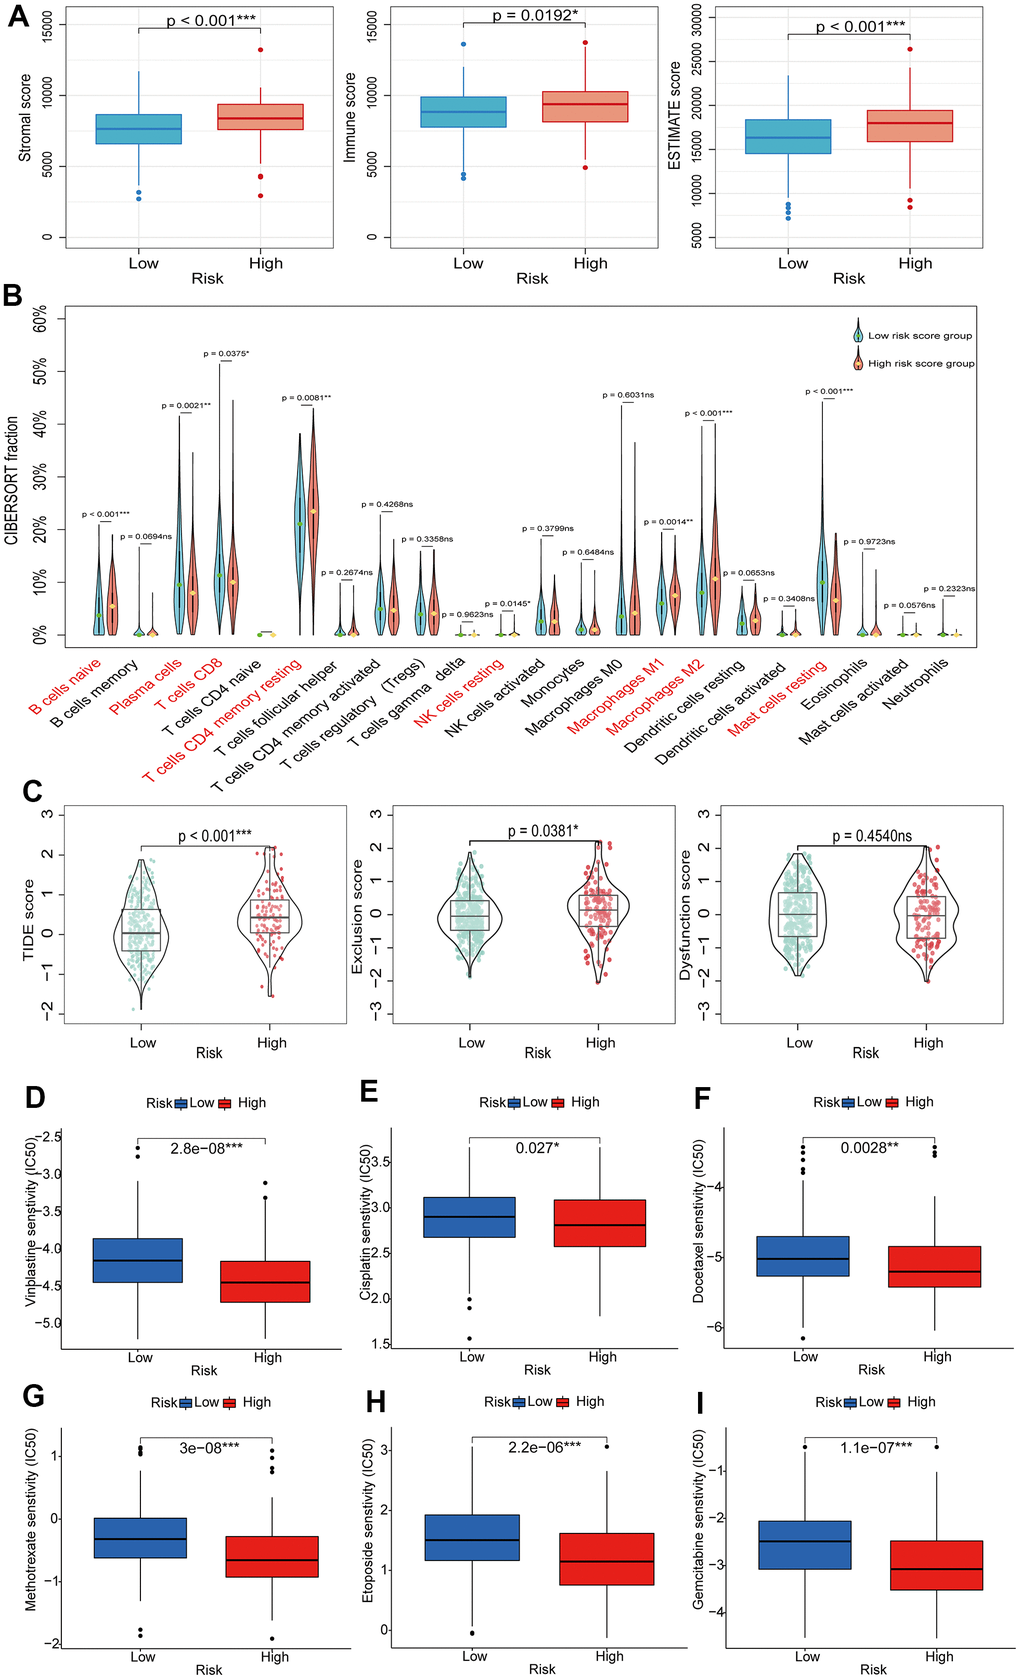
Figure 8.Exploring the relationship between BMRS and TIME, immunotherapy and chemotherapy. (A) Comparison of stromal score, immune score and ESTIMATE score between the high-risk and low-risk groups. (B) Differences in tumor immune cell infiltration between the high-risk and low-risk groups. (C) TIDE scores between high-risk and low-risk groups. (D–I) Association between BMRS and IC50 of chemotherapeutic agents in PCa patients, including Vinblastine, Cisplatin, Docetaxel, Methotrexate, Etoposide and Gemcitabine. ns: p ≥ 0.05, * p < 0.05, ** p < 0.01, *** p < 0.001. TIDE, Tumor Immune Dysfunction and Exclusion. ICIs, immune checkpoint inhibitors. TIME, tumor immune microenvironment.