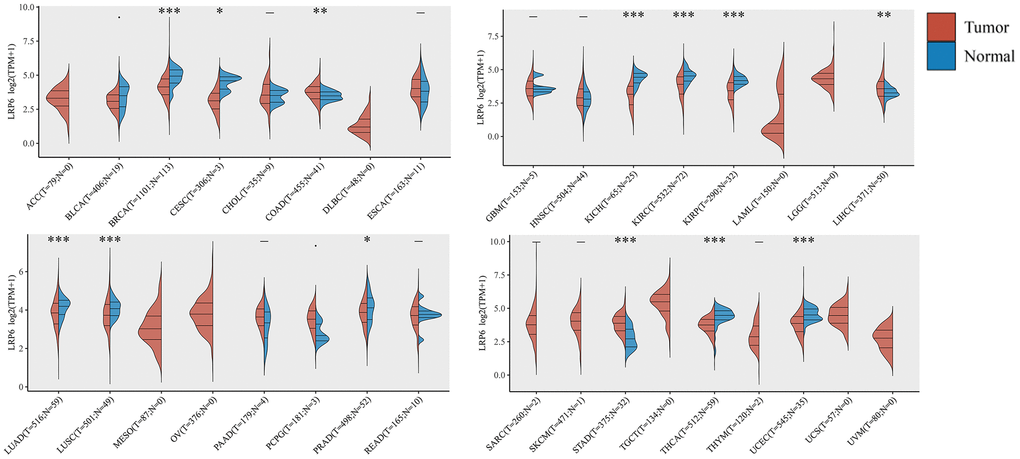
Figure 1.Expression of LRP6 in pancancer. The expression distribution of LRP6 in tumor tissues and normal tissues. The abscissa represents different tumor tissues, and the ordinate represents the expression distribution of gene, different colors represent different groups. *p < 0.05, **p < 0.01, ***p < 0.001.