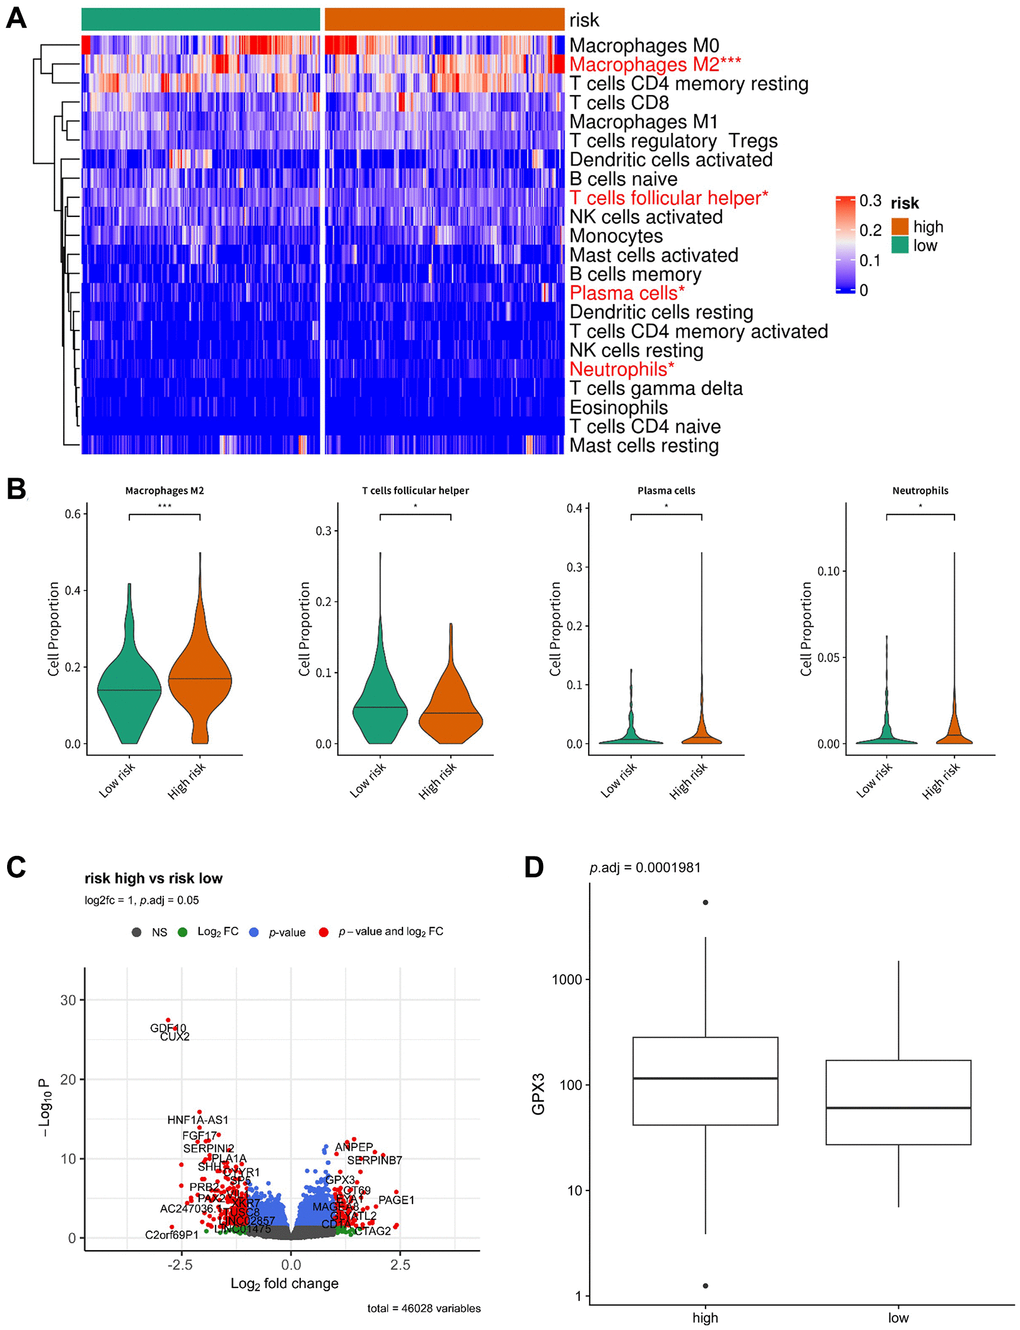
Figure 7.Immune infiltrate analysis of the prognostic model. (A) Heatmap displaying the distribution of 22 different immune cell types in the high-risk group and low-risk group. (B) Box plots illustrating the proportion of macrophages M2, T cells follicular helper, plasma cells, and neutrophils in the low-risk group and high-risk group. (C) Volcano plot depicting the differentially expressed genes between the low-risk group and high-risk group (p < 0.05, |log2Foldchange| > 1). (D) Box plot showing the expression of GPX3 in the low-risk group and high-risk group.