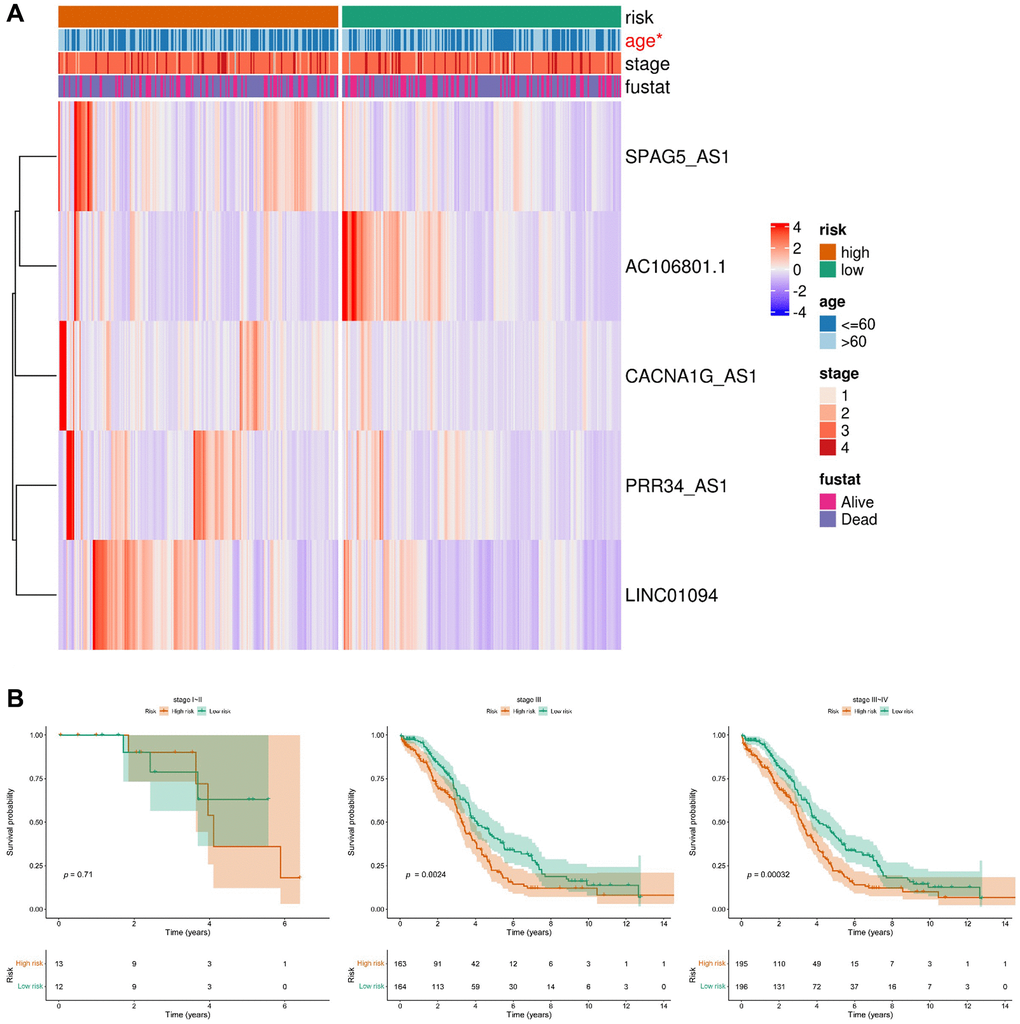
Figure 5.Relationship between the prognostic model consisting of five anoikis-related lncRNAs and clinicopathological features in ovarian cancer patients. (A) Heatmap displaying the distribution of the expression levels of the five lncRNAs in the high-risk group and low-risk group based on different clinicopathological features. (B) Kaplan-Meier curves illustrating the overall survival in different stages.