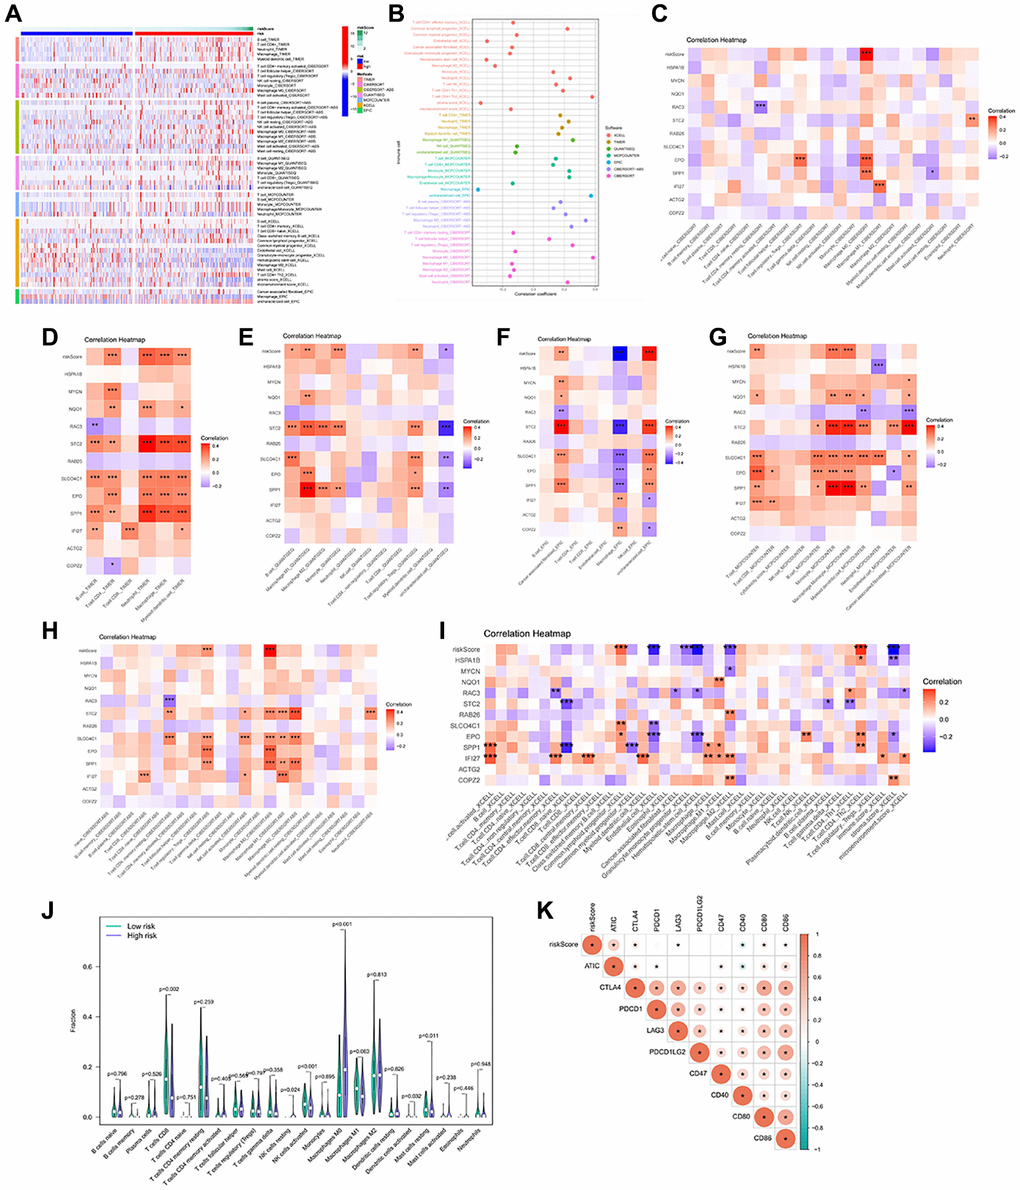
Figure 5.Immune infiltration profile in the risk groups. (A, B) 7 algorithms evaluated the immune cell infiltration between the HCC risk groups. CIBERSORT (C), TIMER (D), QUANTISEQ (E), EPIC (F), MCP-counter (G), CIBERSORT-ABS (H), XCELL (I) to calculate the correlation of signature genes and risk scores with each immune cell. (J) The abundance of immune cells between the high and low risk groups. (K) Heatmap of correlation between Immune checkpoint genes and risk score. *p < 0.05, **p < 0.01, ***p < 0.001.