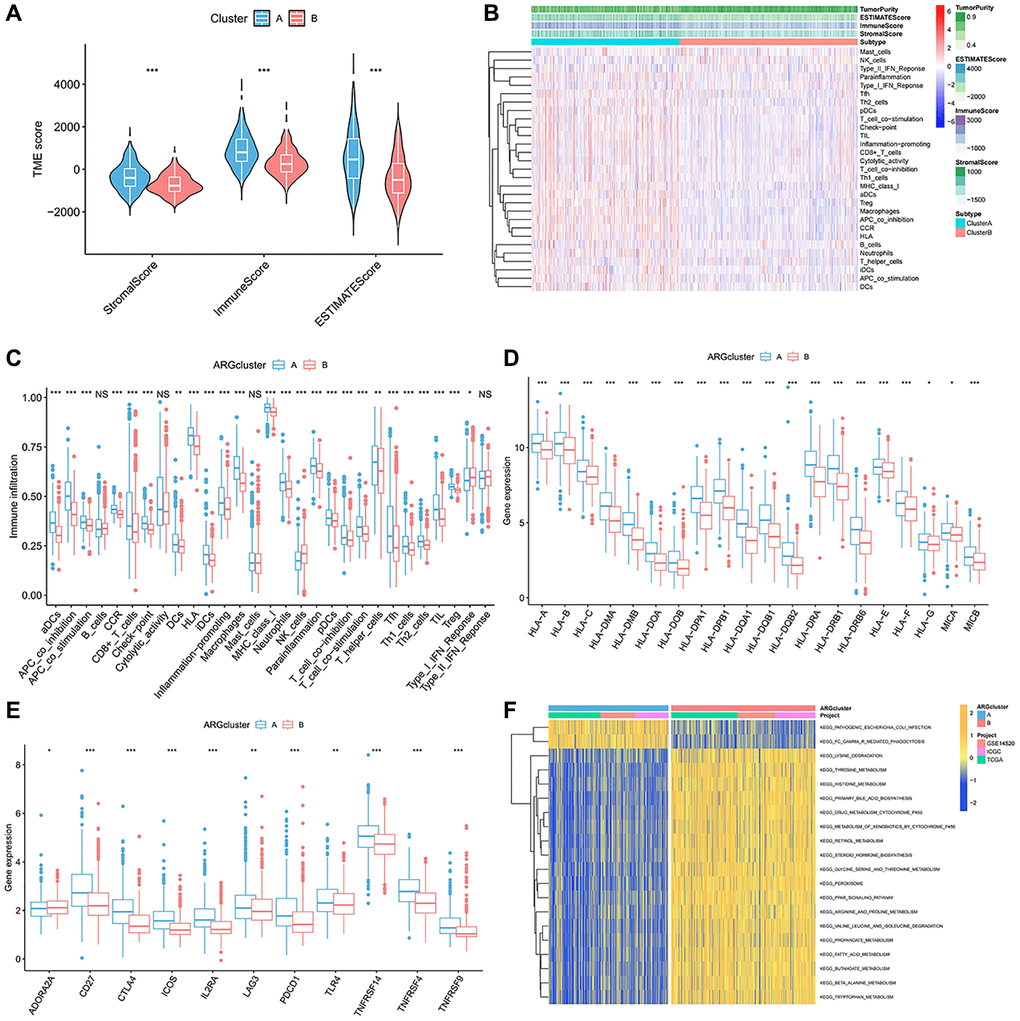
Figure 2.Immune-infiltration landscape in the two anoikis subtypes. (A) The TME score in the A anoikis subtype. (B, C) The native distribution of 29 common immune cells in the anoikis subpopulation. (D) Expression content of the DMHC family genes in each subset. (E) Analysis of the abundance of immunosuppressive molecules in subsets. (F) GSVA analysis of the pathways enriched in the subclusters. *p < 0.05, **p < 0.01, ***p < 0.001.