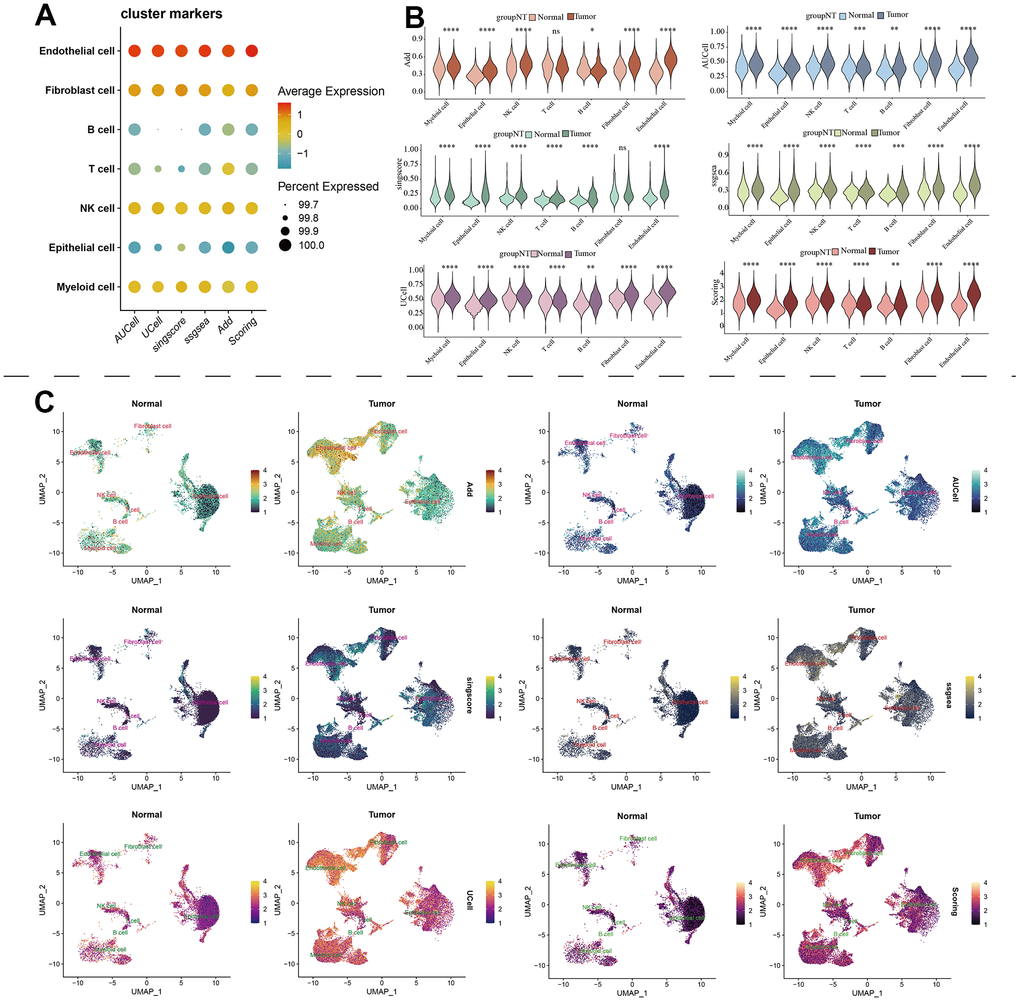
Figure 10.The estimation of MAPK pathway based on scRNA-Seq data. (A) The pathway score of MAPK signaling in each cell type; (B) The discrepancies of MAPK score in each cell type between KIRC and normal samples; (C) The detailed MAPK pathway activity shown in a UMAP plot.