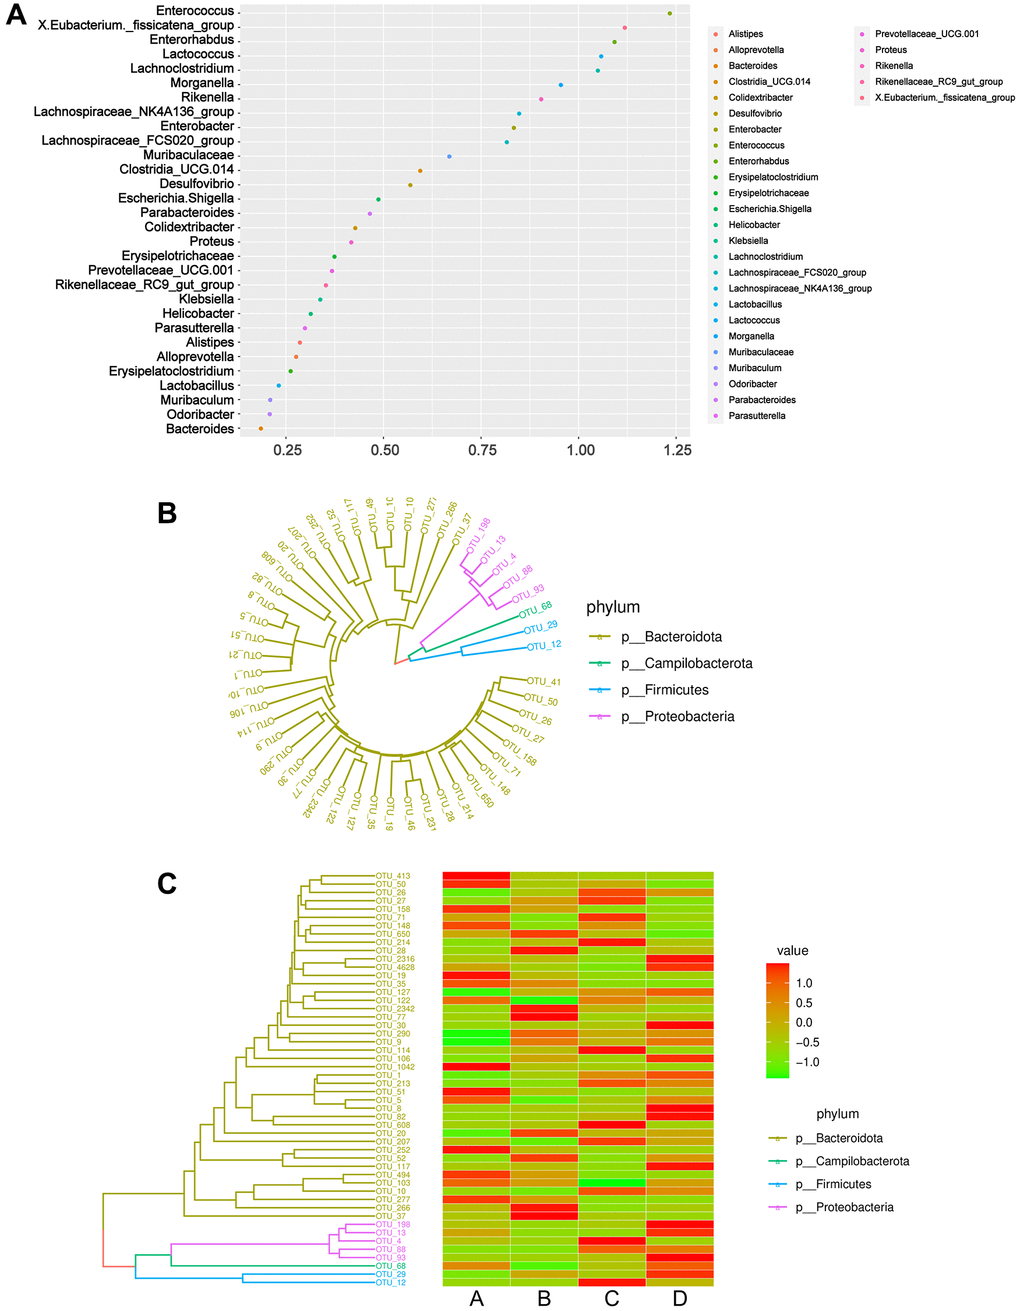
Figure 6.Phylogeny analysis and classification of microbiome community samples. (A) Genera importance point plot. The X-axis represents the measure of importance, and the Y-axis is the genera names ranked by importance. Normalized importance values are used by default in the plot. (B) Phylogenetic tree diagram. Different colors correspond to different phyla. (C) Combination diagram of species abundance and phylogenetic tree. The left is the phylogenetic tree diagram; the right is the abundance map, corresponding to the abundance of the OTU on the left in each group. Abbreviation: OTUs: operational taxonomic units.