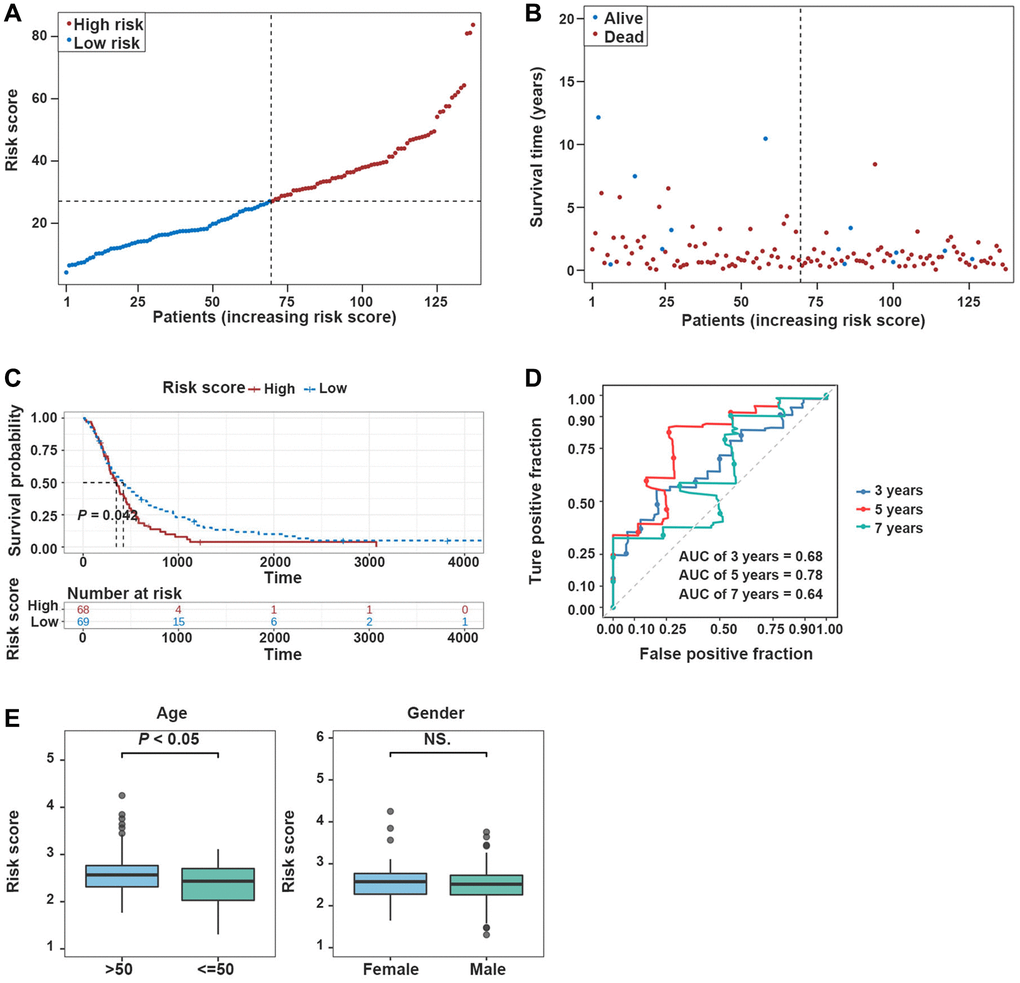
Figure 4.Validation of the prognostic model in the validation dataset. (A, B) Risk plot distribution in the validation dataset. (C, D) The K-M survival curve and the ROC curve in the validation dataset. (E) Box plot of correlation between risk score and clinical features (Age and Gender).