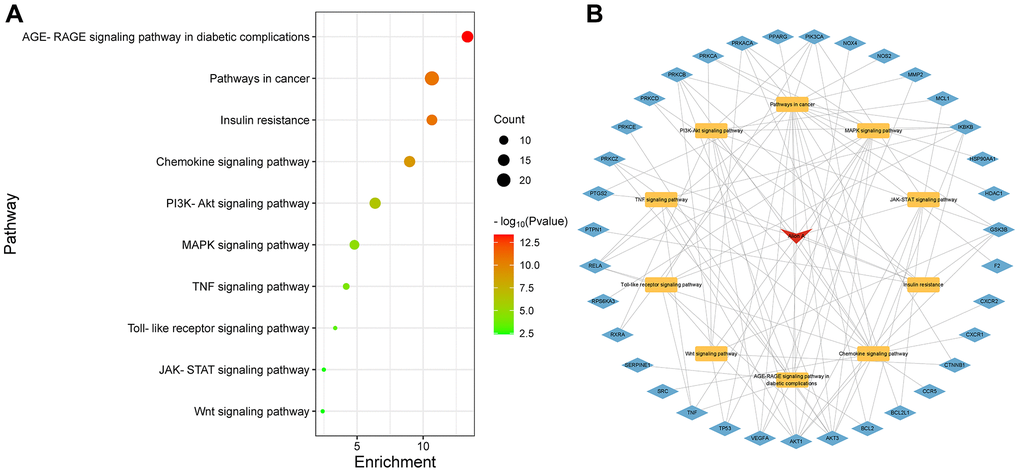
Figure 5.Kyoto Encyclopedia of Genes and Genomes (KEGG) enrichment analysis. (A) KEGG enrichment analysis. The Y-axis represents KEGG pathways. The X-axis indicates the enrichment p-value. (B) Drug-Pathway-Target construction. The red represents drug. The yellow represents related pathway. The blue represents related target genes.