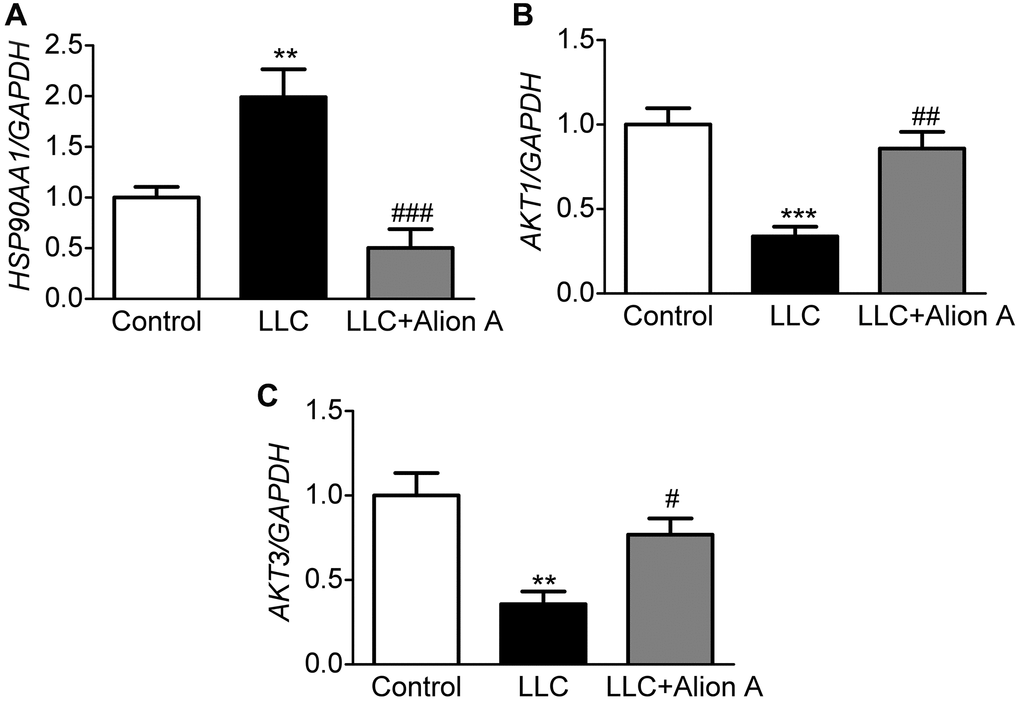
Figure 12.Effect of Aloin A on mRNA expression of HSP90AA1, AKT1 and AKT3 and in skeletal muscle of mice. (A) mRNA expression of HAP90AA1. (B) mRNA expression ratio of AKT1. (C) mRNA expression of AKT3. The values are shown as the mean ± SEM (n = 6). **P < 0.01 vs. the control group. #P < 0.05, ##P < 0.01, ###P < 0.001 vs. the LLC group.