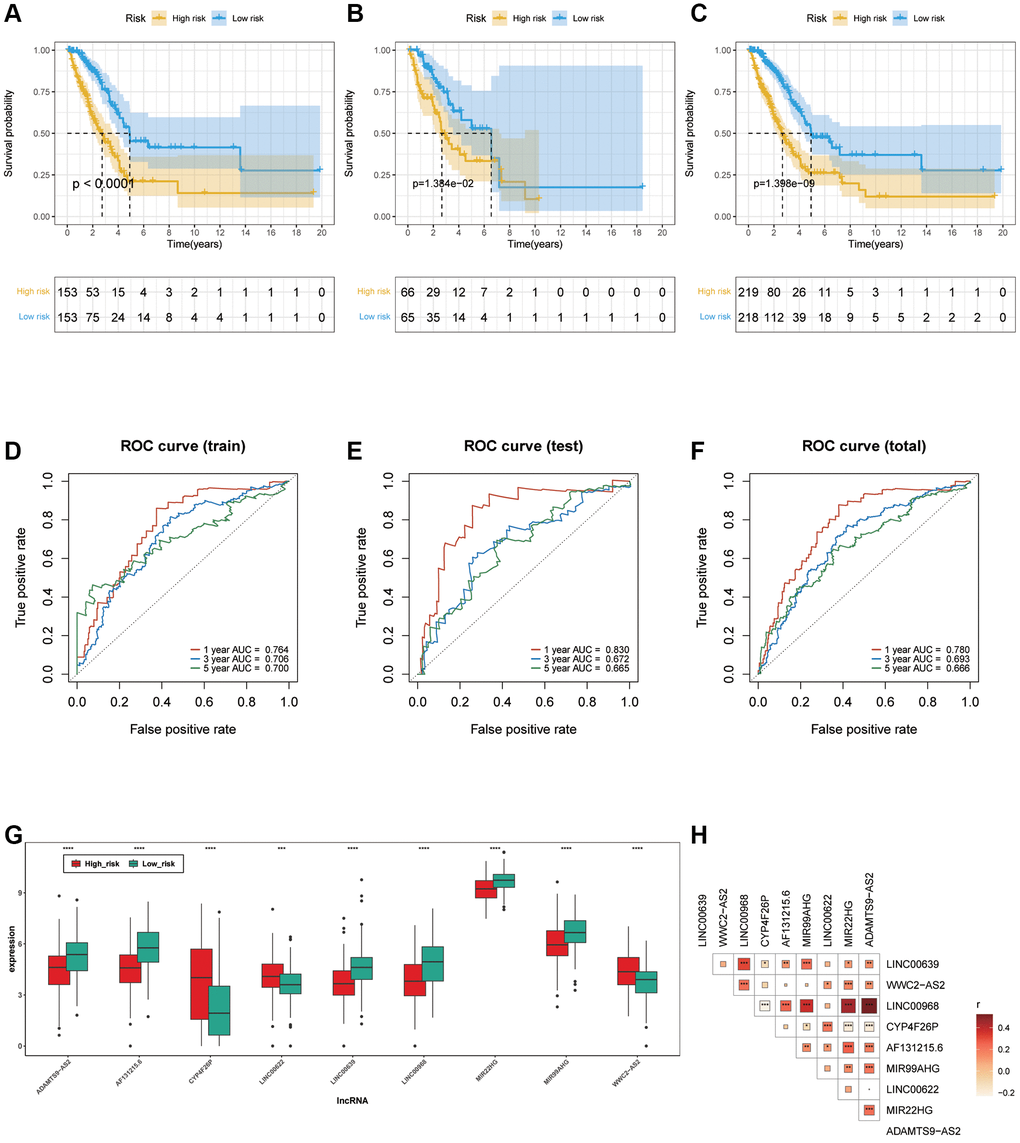
Figure 4.Verification of ARLs prognostic model. (A–C) Kaplan-Meier curve in training, testing and total cohort. (D–F) ROC curve of training, testing and total cohorts. (G) The expression patterns of the 9 ARLs in different subgroups. (H) The correlation of 9 ARLs in various groups.