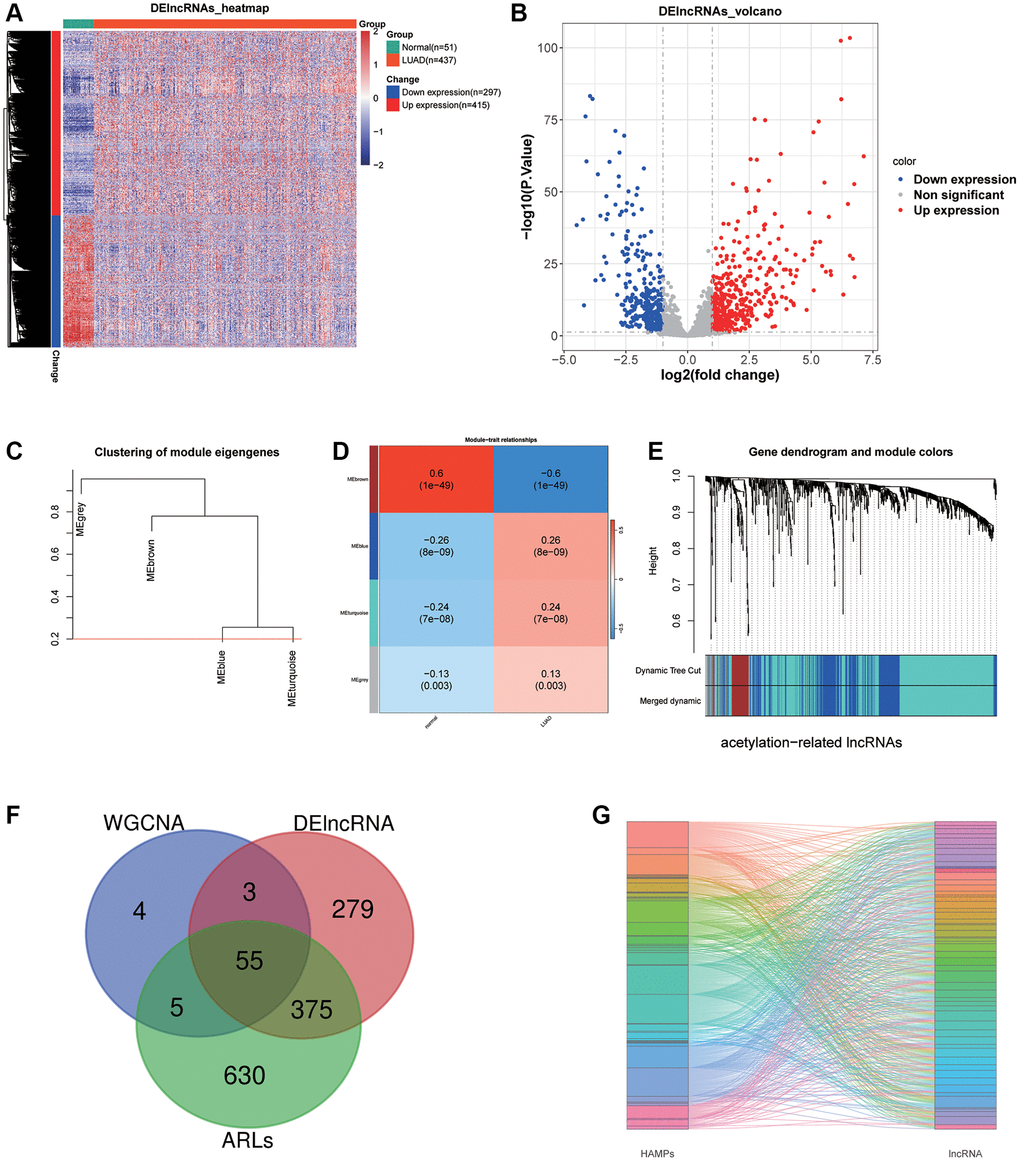
Figure 1.LncRNA sifting. (A, B) Heat map and volcano plot depicting differentially expressed lncRNAs. (C–E) WGCNA selected the most associated modules of LUAD. (F) A Venn graph of intersecting lncRNAs. (G) A Sankey diagram displays 55 acetylation-related lncRNAs.