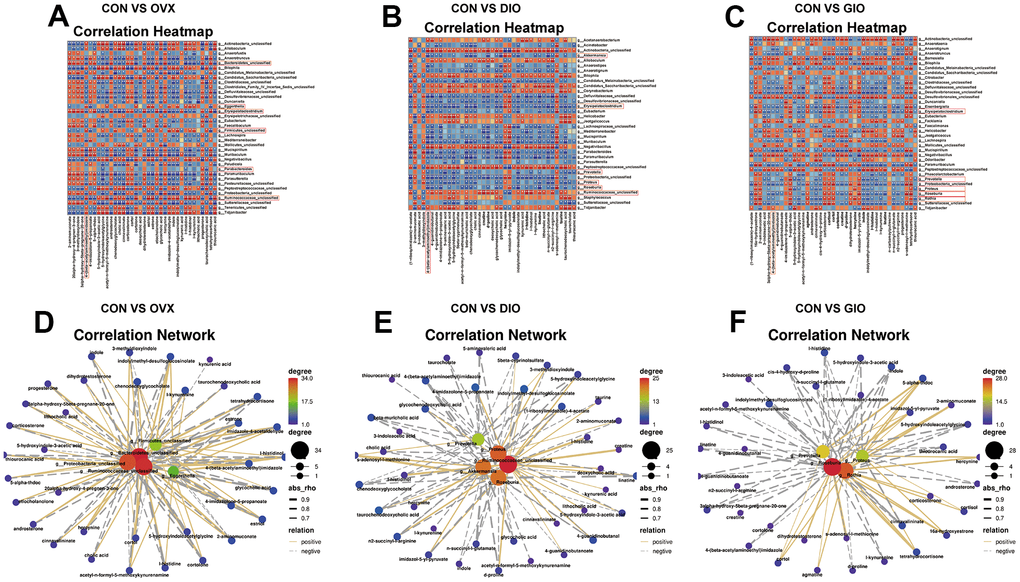
Figure 6.(A–C) Correlation heat map between differential bacterial genera and fecal metabolites associated with lipid and amino acid metabolism in top ten KEGG enrichment analysis; |r| > 0.6; P < 0.05. (D–F) Correlation network map of differential bone metabolism-related bacterial genera and fecal metabolites associated with lipid and amino acid metabolism in top ten KEGG enrichment analysis; |r| > 0.6; P < 0.05; n = 6.