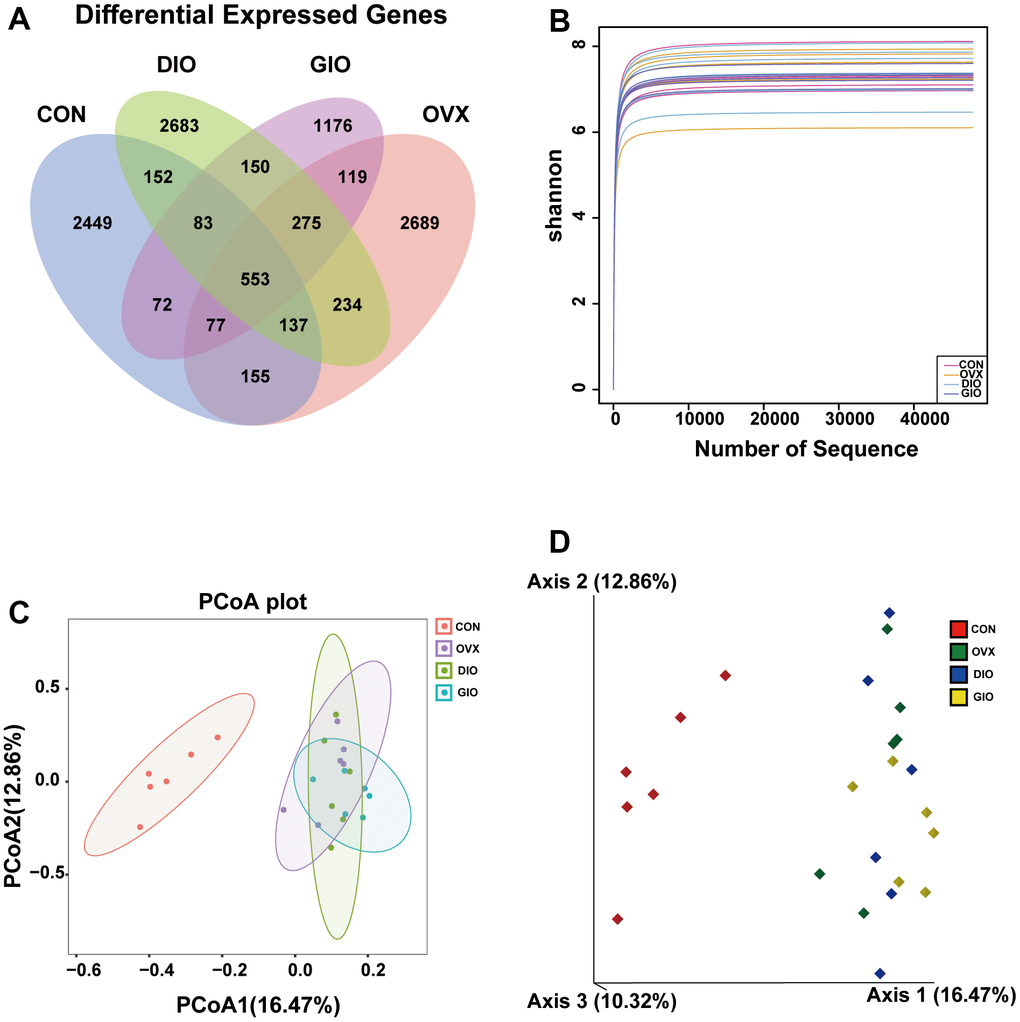
Figure 3.(A) Venn diagram showing numbers of amplicon sequence variants (ASVs) per group. (B) Rarefaction curves of Shannon index α-diversity analysis. (C) 2D model of gut microbiota PCoA. CON: orange; OVX: purple; DIO: light green; GIO: dark green. (D) 3D model of gut microbiota PCoA. CON: red; OVX: green; DIO: blue; GIO: yellow; n = 6.