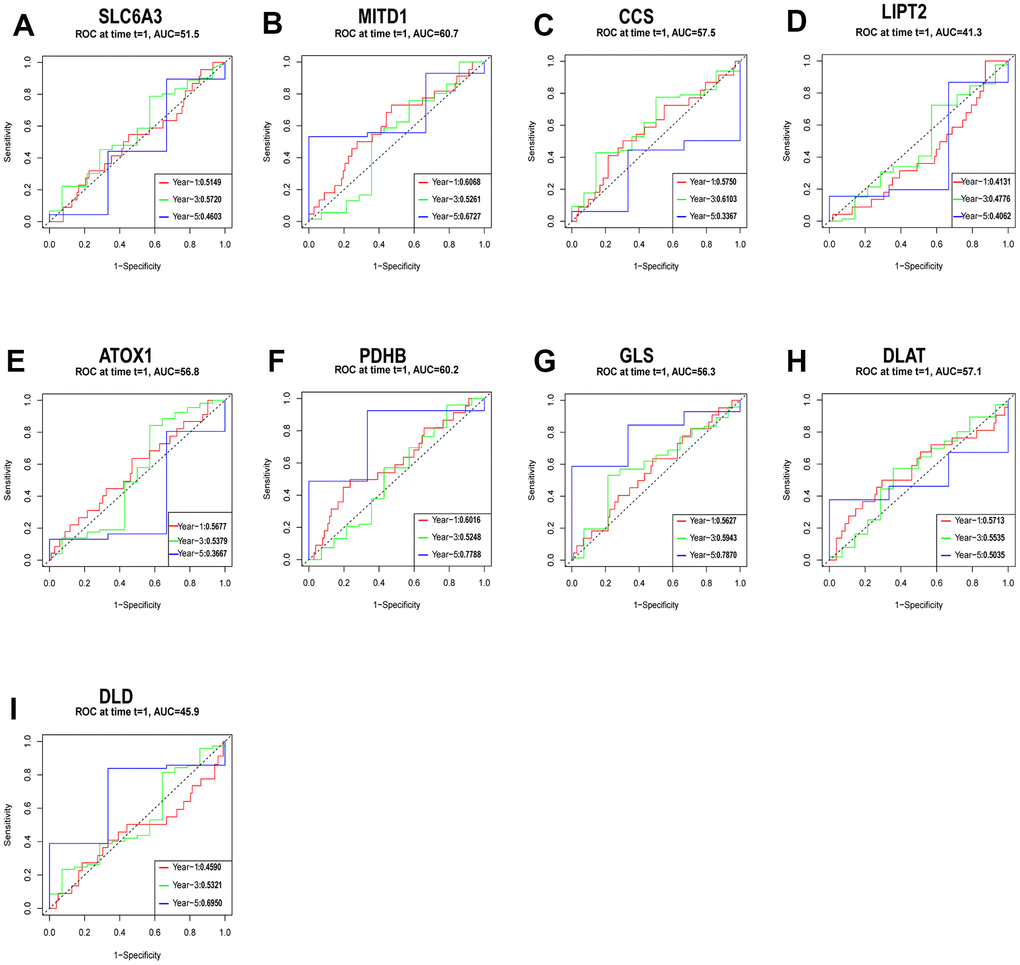
Figure 9.Evaluation of the independent prognostic value of gene expression using timeROC curves for 1-, 3-, and 5-year overall survival (OS) predictions of SLC6A3 (A), MITD1 (B), CCS (C), LIPT2 (D), ATOX1 (E), PDHB (F), GLS (G), DLAT (H), and DLD (I) through the nomogram in the TCGA cohort.