Submit an Article
Navigate
Home
Editorial Board
Editorial Policies
Current Volume
Archive
Scientific Integrity
Publication Ethics Statements
Interviews with Outstanding Authors
Newsroom
Sponsored Conferences
Podcast
Contact
Special Collections
Submit an Article
Online ISSN: 1945-4589
Research Paper
|
Volume 15, Issue 24
|
pp. 15504–15524
Comprehensively prognostic and immunological analysis of VRK Serine/Threonine Kinase 1 in pan-cancer and identification in hepatocellular carcinoma
Back to article
Figure 8
(8 of 9)
−
100%
+
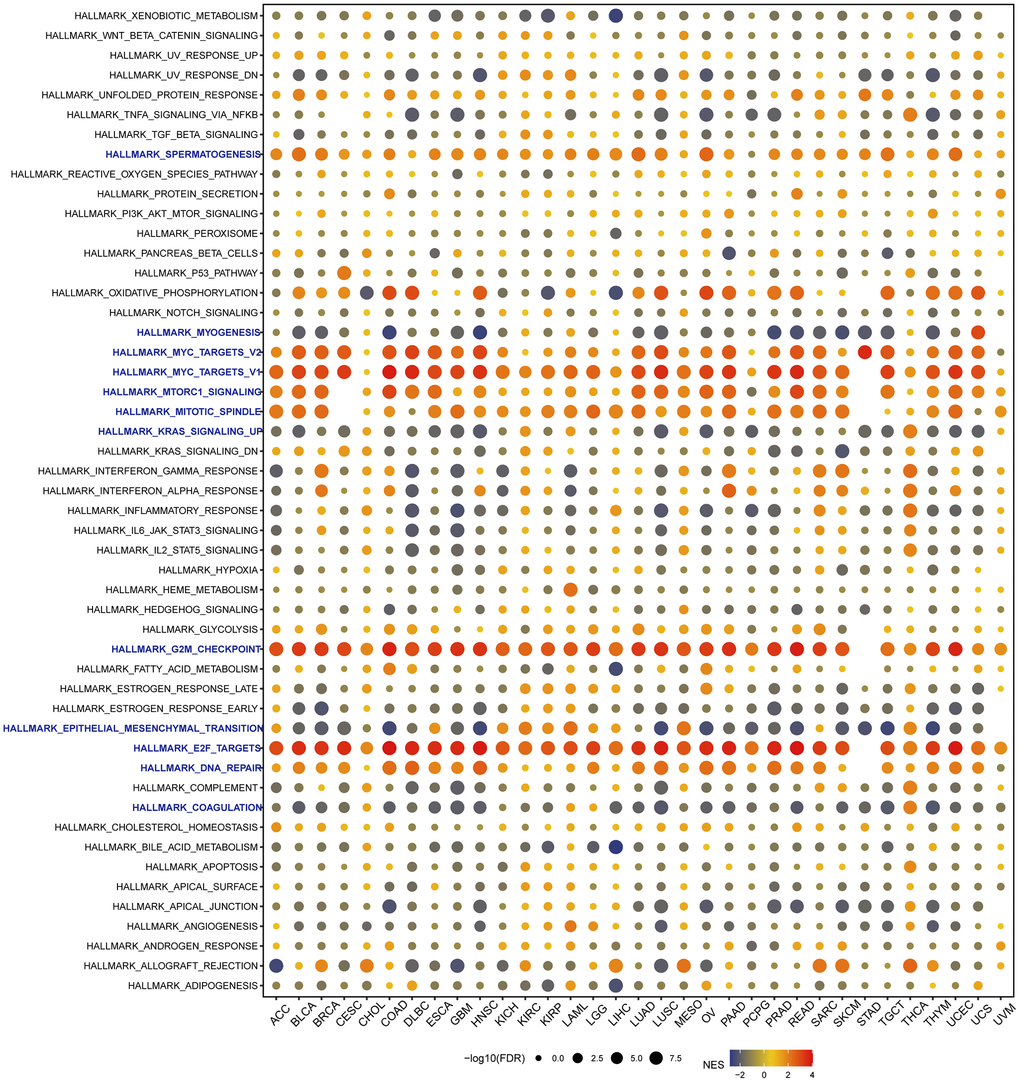
Figure 8.
Gene set enrichment analysis (GSEA) of VRK1 in pan-cancer.
The circle size represents the FDR value of the enriched term in each cancer, and the color indicates the normalized enrichment score (NES) of each term.