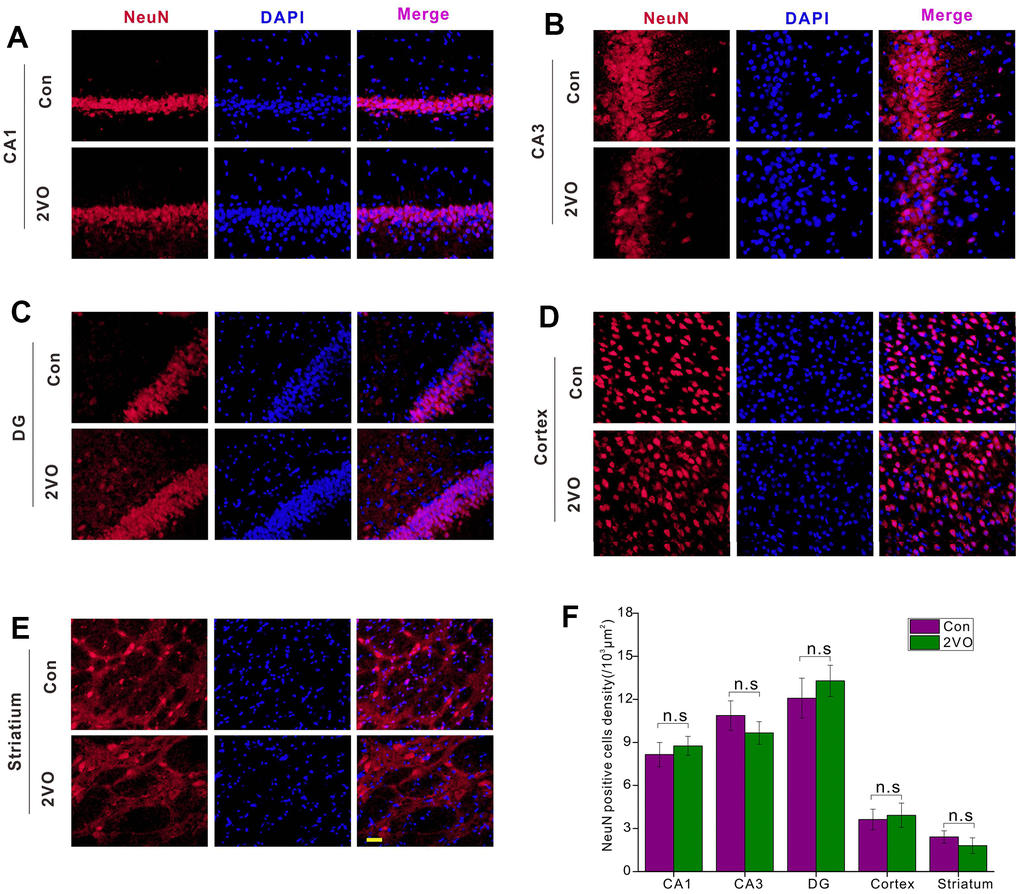
Figure 3.The neuronal densities in different regions of the brain were evaluated with the immunofluorescent NeuN-labeled staining. (A) CA1, (B) CA3, (C) DG, (D) Cortex, (E) Striatium regions were stained with NeuN antibody and DAPI. The red and blue staining indicated the NeuN-labeled neurons and the nucleus, respectively. The purple indicated the merge of both. (F) Count of NeuN-labeled neurons in different regions. Scale bar=10μm. [(Con group, n=3), (2VO group, n=3)].