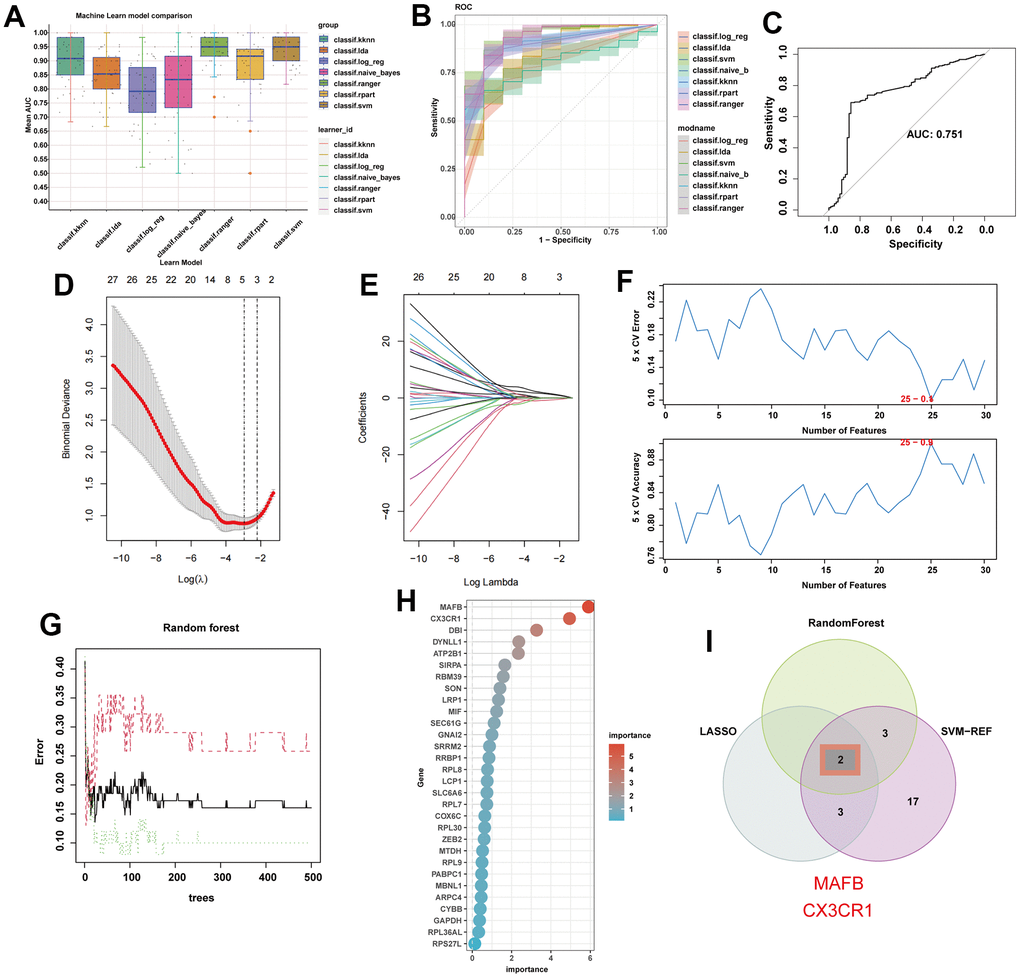
Figure 6.Machine learning identifies optimal feature genes of NAFLD. (A) Seven machine learning algorithms were utilized for model construction. (B) The ROC values of all seven algorithms in the training group. (C) The ROC scores of the SVM model were presented in the test group. (D) Lasso algorithm for selection features. (E) Coefficient changes of the selected features using lasso algorithm. (F) The SVM algorithm was used to further candidate optimal feature genes with the highest accuracy (the lower) and lowest error (the upper) obtained in the curves. The x-axis represents the number of feature selections, and the y-axis indicates the prediction accuracy. (G) The impact of the number of decision trees on the error rate was examined. The x-axis represents the number of decision trees, while the y-axis indicates the error rate. (H) The relative importance of potential feature genes was calculated in random forest (Top 5 genes’ importance > 2). (I) Venn diagram showing the overlap between the three algorithms.