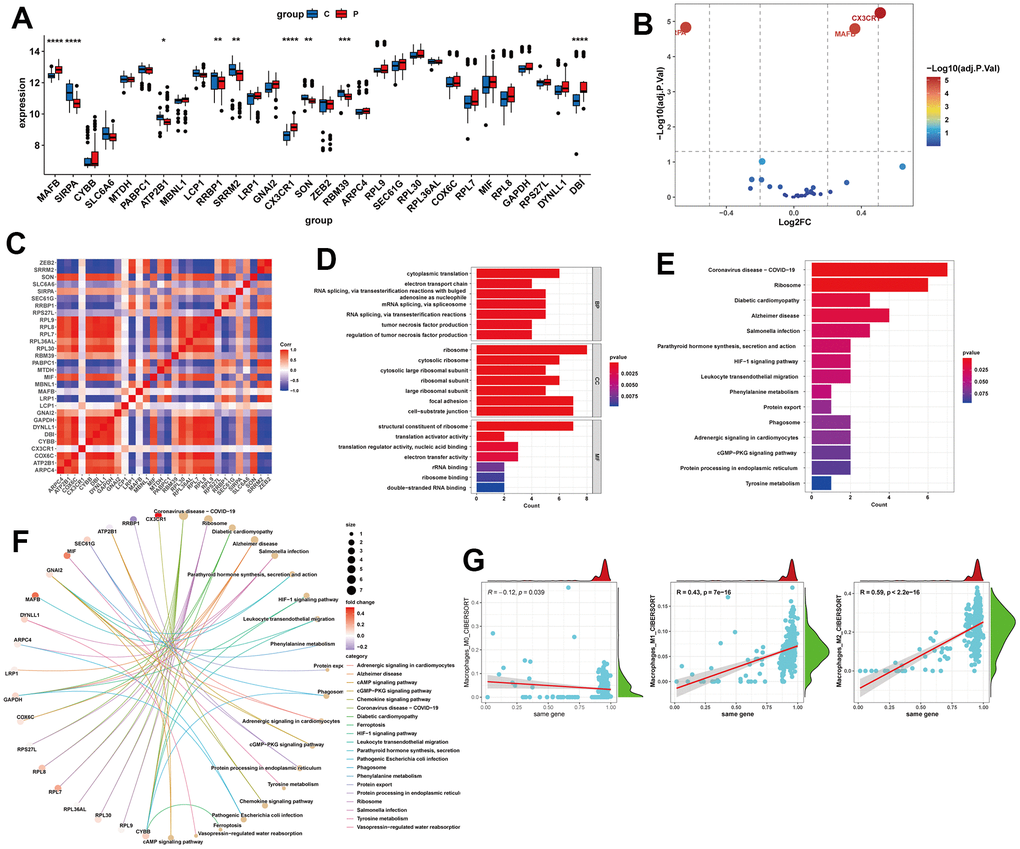
Figure 5.Expression analysis and functional enrichment of potential feature genes. (A, B) Expression analysis of potential feature genes between NAFLD and normal samples. (C) Correlation analysis between potential feature genes. (D) Enrichment analysis of potential feature genes using Gene Ontology (GO). BP, biological process; CC, cellular component; MF, molecular function. (E, F) Enrichment analysis of potential feature genes using the Kyoto Encyclopedia of Genes and Genomes (KEGG). (G) Correlation analysis between potential feature genes and M0, M1, and M2 macrophages. *P < 0.05, **P < 0.01, ***P < 0.001, ****P < 0.0001.