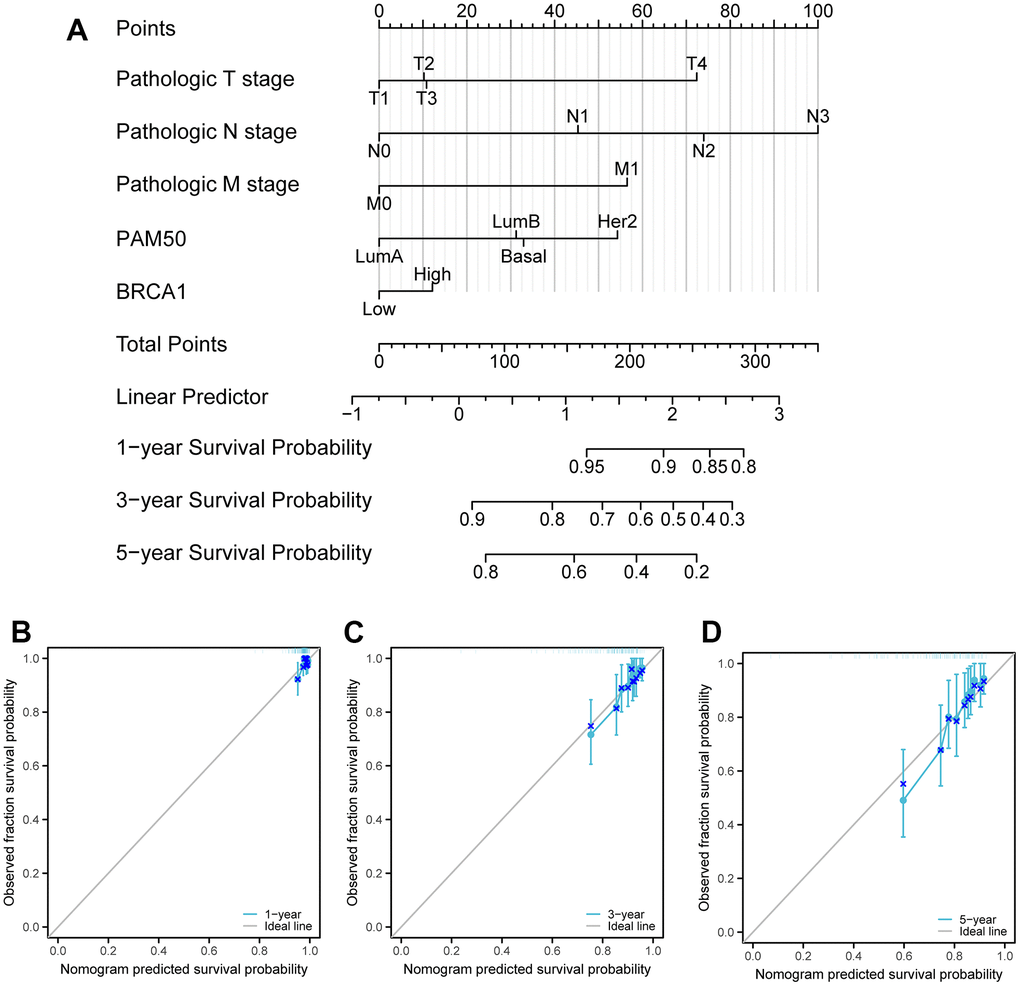
Figure 9.Calibration curves and a nomogram and for prediction OS rates of BRCA patients. (A) A nomogram chart was a visual representation that displays the data of BRCA patients’ OS rates at specific time intervals, such as one, three, and five years. (B–D) Calibration curves were graphical tools used to predict the survival rates of cancer patients at specific time points.