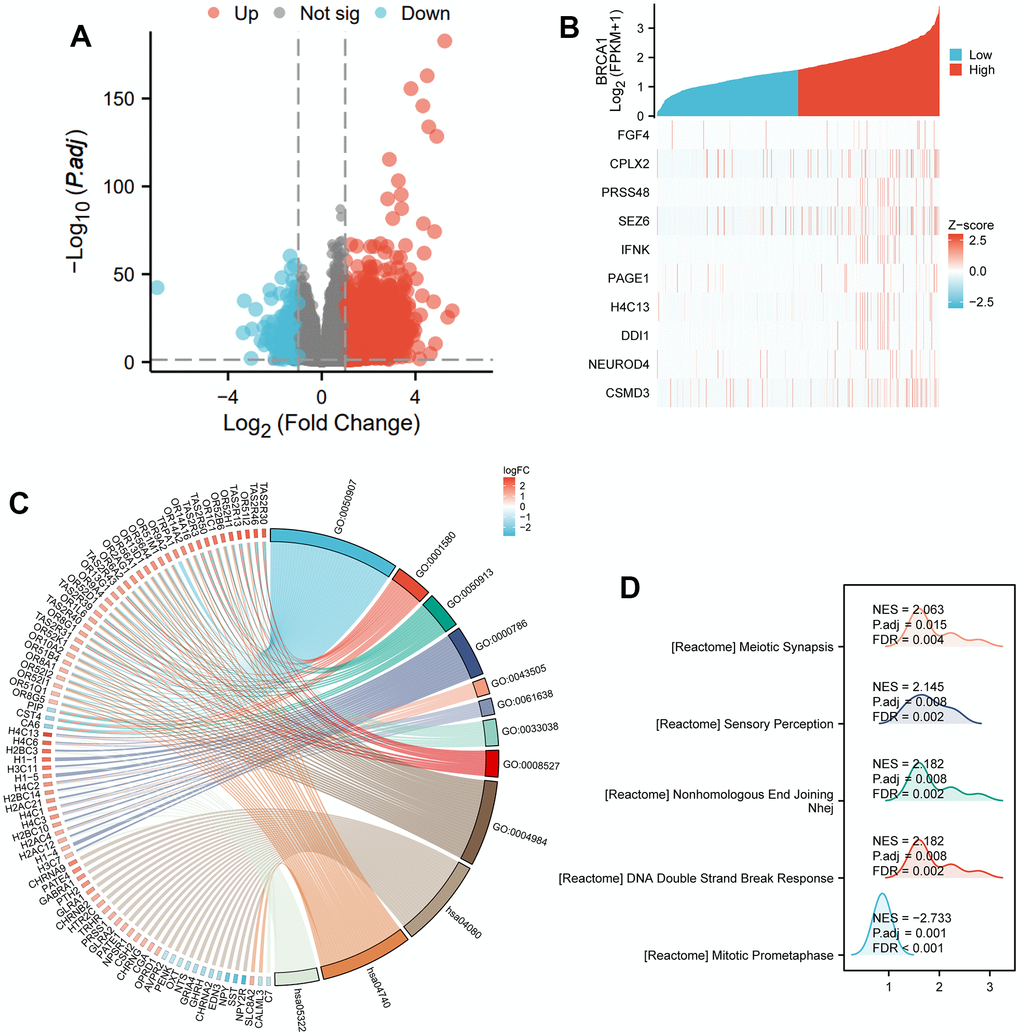
Figure 6.DEGs related to BRCA1 and its functional enrichment analysis utilizing GSEA, GO and KEGG. (A) Blue and red dots indicated the vitally down- and up-regulated DEGs in the Volcano plot, respectively. (B) The top ten DEGs positively correlated with BRCA1 level. (C) KEGG, GO and GSEA (D) analysis of DEGs.