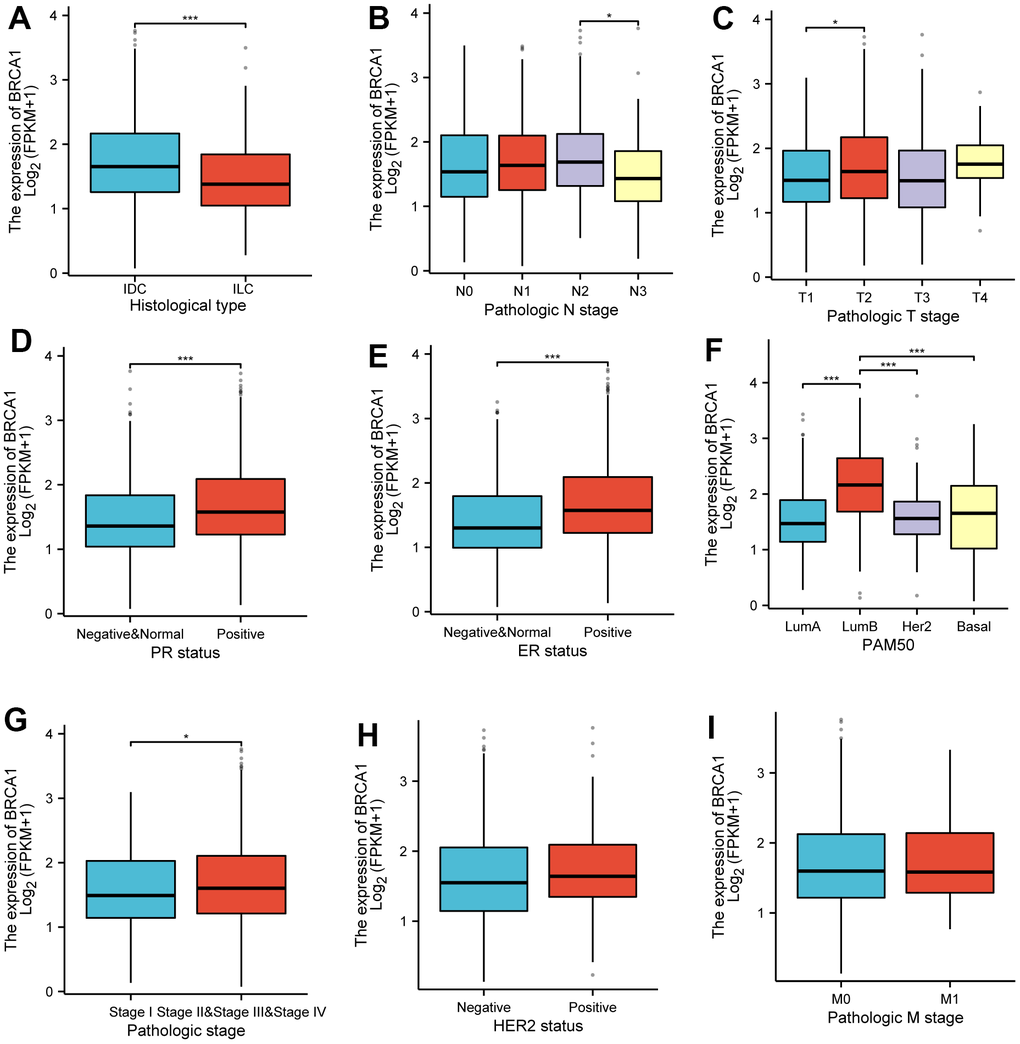
Figure 3.Associations between BRCA1 expression and clinicopathological characteristics. Data were shown for (A) histological type, (B) N stage, (C) T stage, (D) PR status, (E) ER status, (F) PAM50, (G) pathological stage, (H) HER2 status, (I) M stage. P-values were calculated with two-tailed unpaired Student’s t-test, *p < 0.05, **p < 0.01, ***p < 0.001.