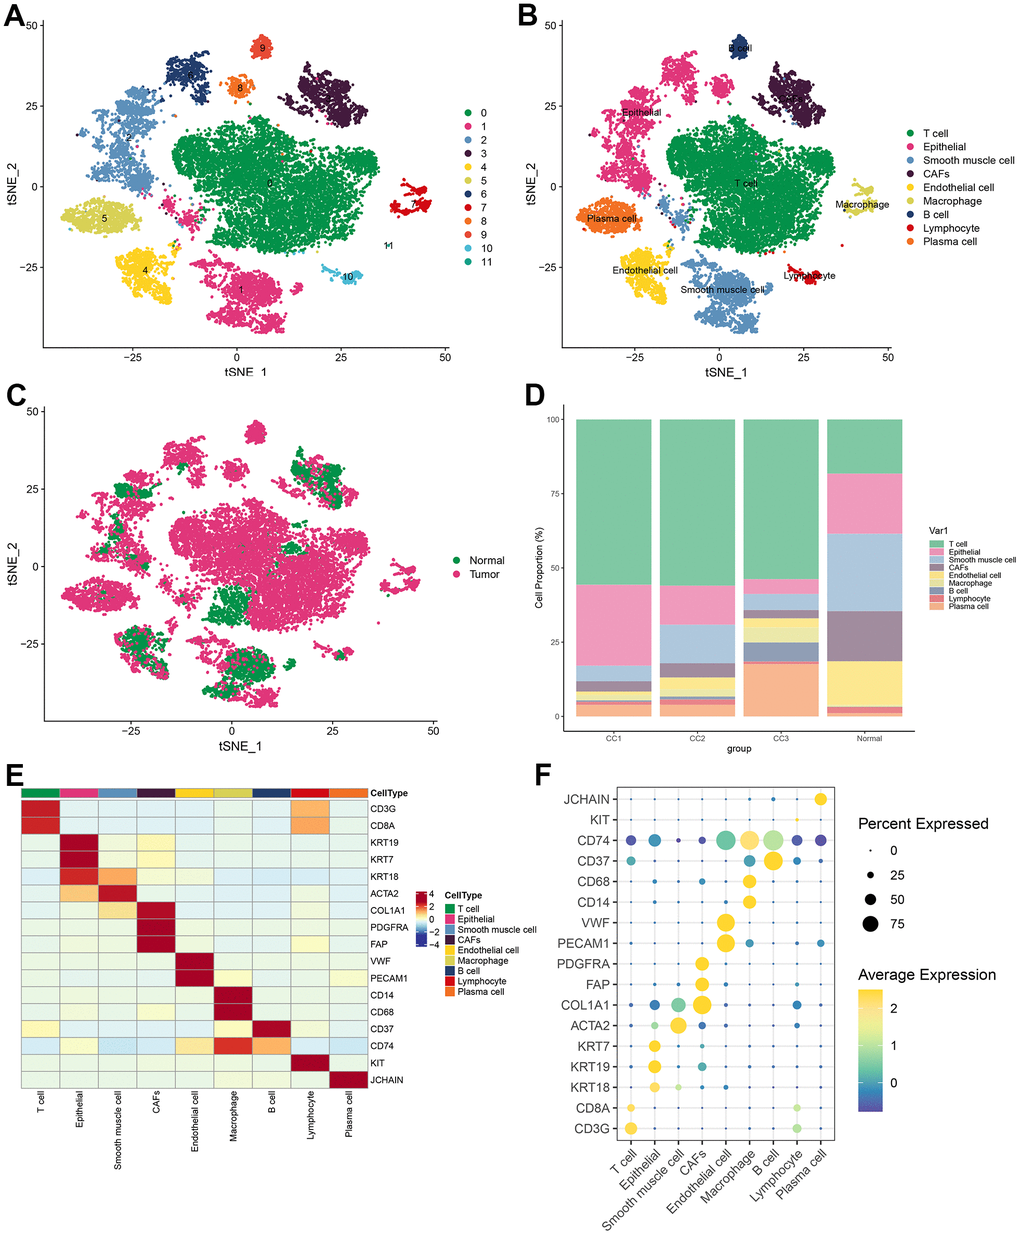
Figure 1.Visualization of tSNE for cell descending clustering. (A) tSNE plot of 12 cell clusters; (B) tSNE plot of 9 cell types; (C) tSNE plot of normal and tumor cells; (D) Proportion of each cell type in different samples; (E) Heat map of marker gene expression for 9 types of cells; (F) Bubble map of marker gene expression for 9 types of cells.