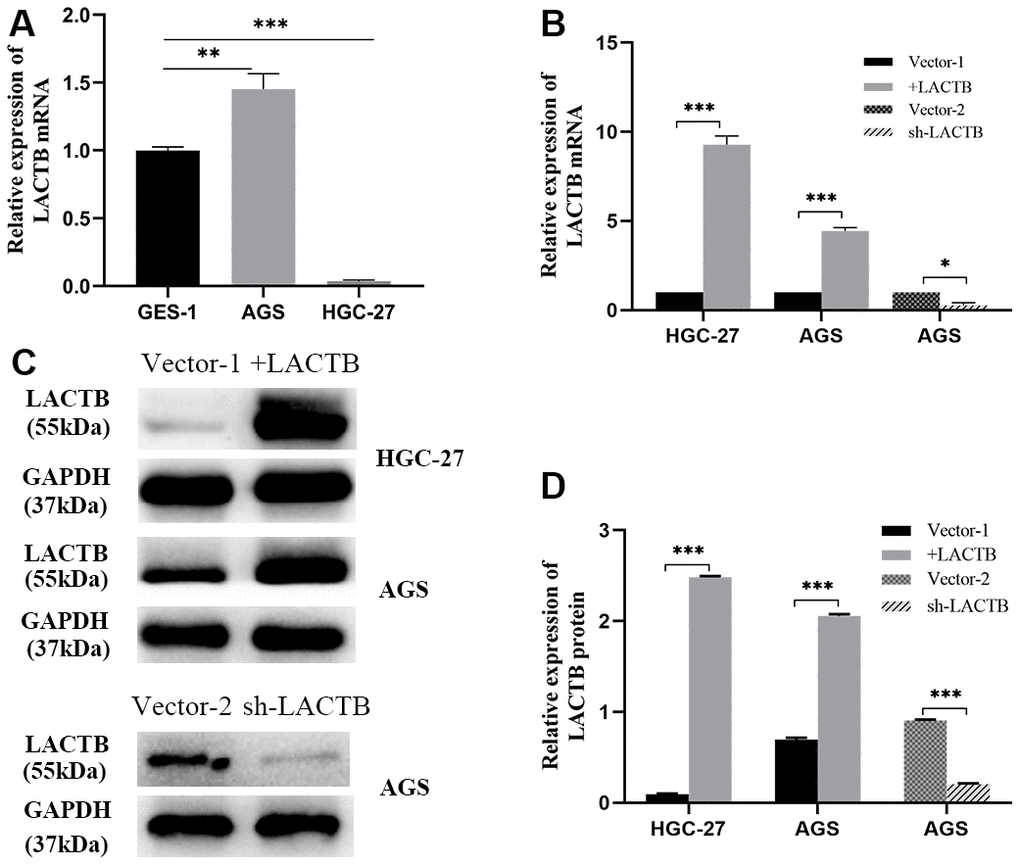
Figure 3.Construction of LACTB stable overexpression and knockdown cell lines. (A) LACTB transcript variant 1 expression in AGS and HGC-27 vs GES-1. (B) The expression level of LACTB transcript variant 1 in stably transfected strains. (C, D) Expression levels of LACTB protein in stably transfected strains. *P<0.05, **P<0.01, ***P<0.001.