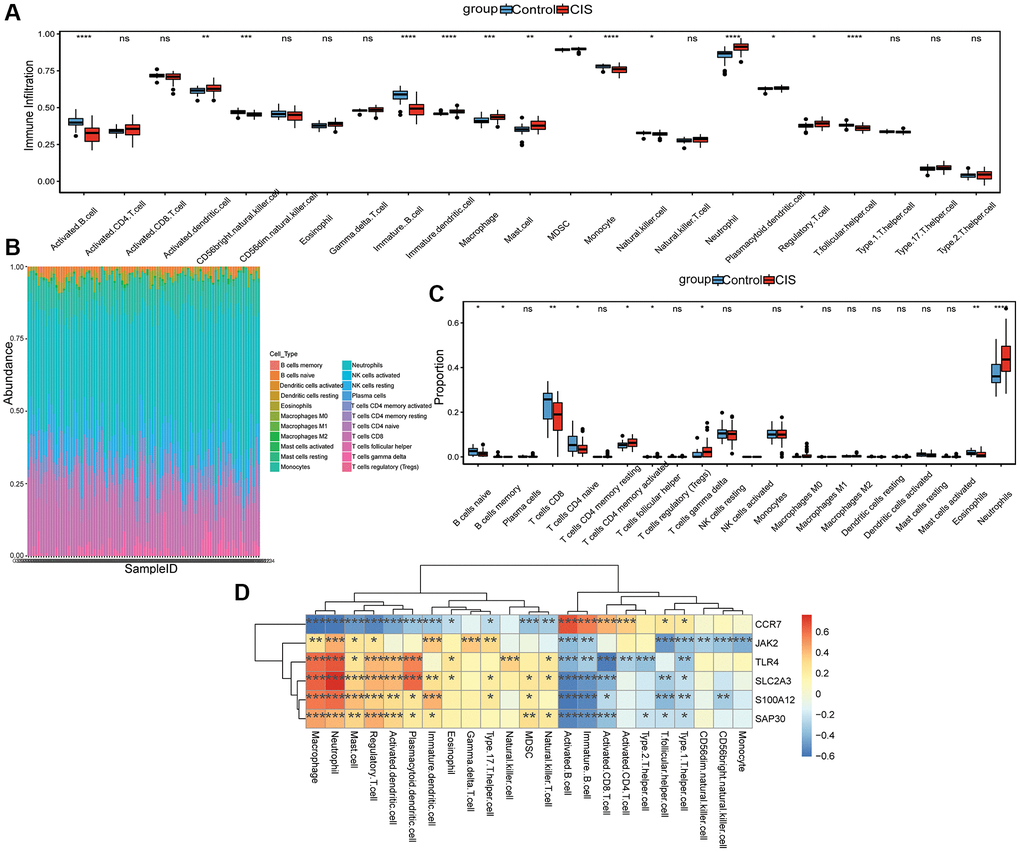
Figure 6.Analysis of immune cell infiltration. (A) The level of immune cell infiltration was analyzed by ssGSEA method; (B) Stacked histogram of the proportion of each immune cell in the sample analyzed by CIBERSORT method; (C) Box diagram of the proportion of each immune cell in the sample analyzed by CIBERSORT method; (D) Correlation between hub mRNAs and immune cell infiltration. Red and blue represent positive and negative correlations, respectively. *P < 0.05, **P < 0.01, ***P < 0.001, ****P < 0.0001, Abbreviation: ns: no significant significance.